A couple of weeks ago, I had a performance issue on my VPS. I spent several days trying to find the problem, and it was difficult to pinpoint. During the process, I came across tools that helped me achieve my goal. At first, I thought I needed to upgrade my RAM or CPU, but it was something more serious: I was suffering from a cryptojacking attack.

What is a cryptojacking attack?
It's a type of cyberattack in which a hacker uses the processing power of someone else's computer, smartphone, or server (like your VPS) to mine cryptocurrency without the owner's consent or knowledge. Unlike other attacks that aim to steal data or encrypt files (ransomware), cryptojacking is "silent": its goal is to go undetected for as long as possible to continue generating money at the expense of your hardware and your electricity bill.

My PC was practically locked down, and several tools helped me fix it. It was days of hard work, but I finally managed to solve the problem. Most VPSs don't include a good tool that shows us in detail how the RAM, CPU, swap space, bandwidth, and other resources of our VPS are performing.
My PC was practically hijacked, and several tools helped me fix it. It was days of hard work, but I finally managed to resolve the problem. During that process, I realized I needed to constantly monitor my VPS, since any increase in RAM, CPU, etc. usage could mean my VPS is under attack or has already been hijacked. I prefer to prevent that from happening in advance. There are free tools that help us see the real-time status of our hardware resources. Most VPSs don't include a good tool that shows us in detail how the RAM, CPU, swap space, bandwidth, and other resources of our VPS are performing.
5 Tools to Monitor Your VPS with the Linux Terminal
I'm going to share 5 tools that will help you monitor the status of your VPS in real time.
1. Btop++ (The most visually appealing)
It's the evolution of bashtop and bpytop. It's probably the most aesthetically pleasing terminal tool available today. It offers a dashboard-style interface that displays CPU, memory, disks, network, and processes with high-quality graphics.
Best features: It has mouse support within the terminal and is extremely easy to read.
To install and use it, follow these commands (on Debian/Ubuntu):
sudo apt update
sudo apt upgrade -y
sudo apt install btop
btop
After running the btop command, the tool will open:
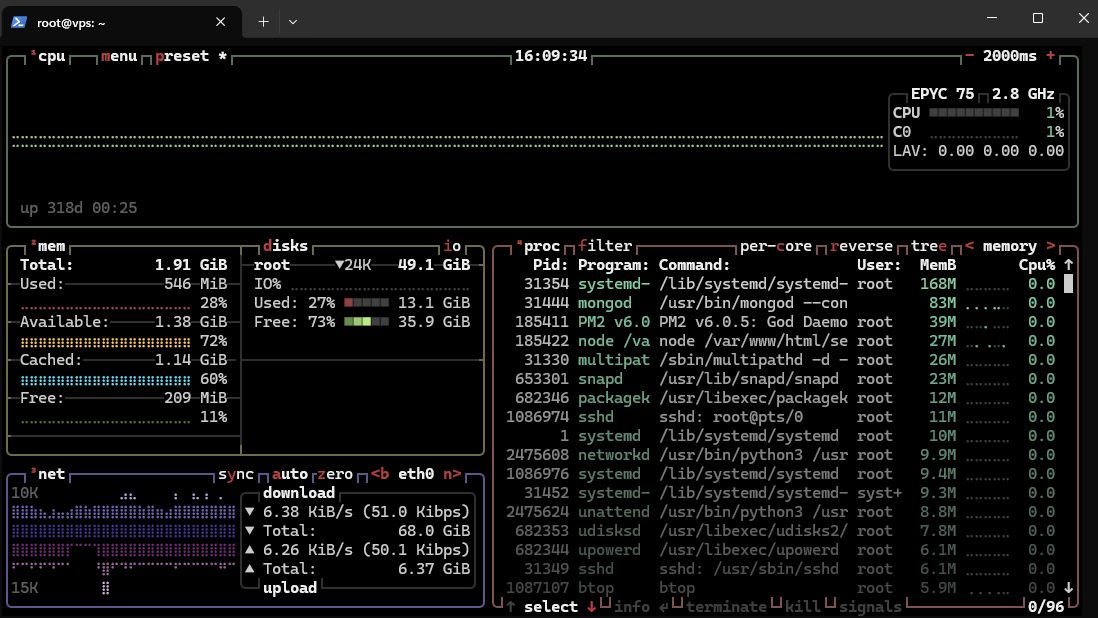
At the top, you can see in real time how the VPS's performance fluctuates. If the line is distorted, it's because there is activity on the VPS. You can also see how much RAM is being used and how much is available.
You can also see how much RAM is being used and how much is available. It shows us how much disk space we have, how much is being used, and how much free space remains. Below, we can see the download and upload speeds in terms of bandwidth. The coolest thing is the information on the right, where you can see the processes running in real time.
2. Htop
This is an interactive upgrade to the classic top command. If you need something lightweight that's available in almost every repositories and lets you quickly "kill" processes with a couple of keystrokes, this is the tool for you.
Best features: Very lightweight, allows you to search for processes by name and filter by user.
To install and use it, follow these commands (on Debian/Ubuntu):
sudo apt update
sudo apt upgrade -y
sudo apt install htop
htop
After running the htop command, the tool will open:
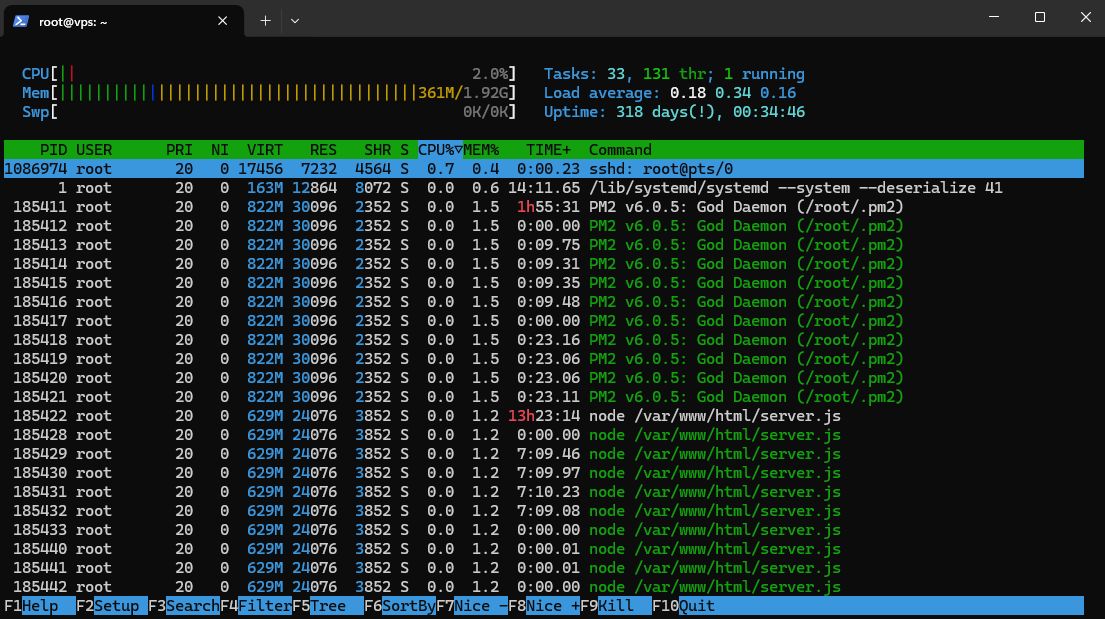
It provides information in a practical way; you can see CPU usage at 2%, which is very stable. It also gives you information about RAM and swap space (if available). What I like most is the display of processes with their PIDs, which is useful if you need to terminate them quickly.
3. Glances
Written in Python, Glances focuses on displaying as much information as possible on a single screen. If your terminal is large enough, you'll see everything from CPU usage to temperature warnings and network load.
Best feature: It has a "server" mode that lets you view the statistics from a web browser if you wish, simply by running glances -w.
To install and use it, follow these commands (on Debian/Ubuntu):
sudo apt update
sudo apt upgrade -y
sudo apt install glances
glances
After running the glances command, the tool will open:
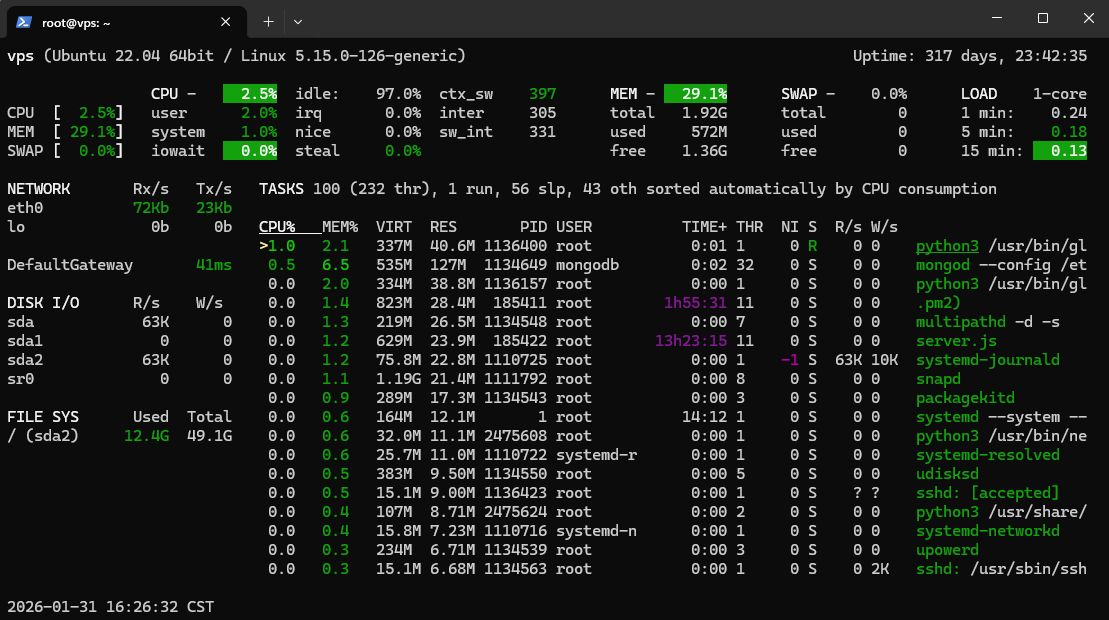
The most important information is highlighted against a bright green background with white lettering. Other information is shown only in green. It displays how many days the VPS has been running.
4. Bpytop
Bpytop is the preferred choice if you're looking for extreme customization and a design straight out of a hacker movie. It's excellent for viewing the load history of each CPU core individually.
Best feature: Bpytop uses colors to alert you (red if the temperature rises, orange if the RAM runs out) and is much more intuitive.
To install and use it, follow these commands (on Debian/Ubuntu):
sudo apt update
sudo apt upgrade -y
sudo apt install bpytop
bpytop
After running the bpytop command, the tool will open:
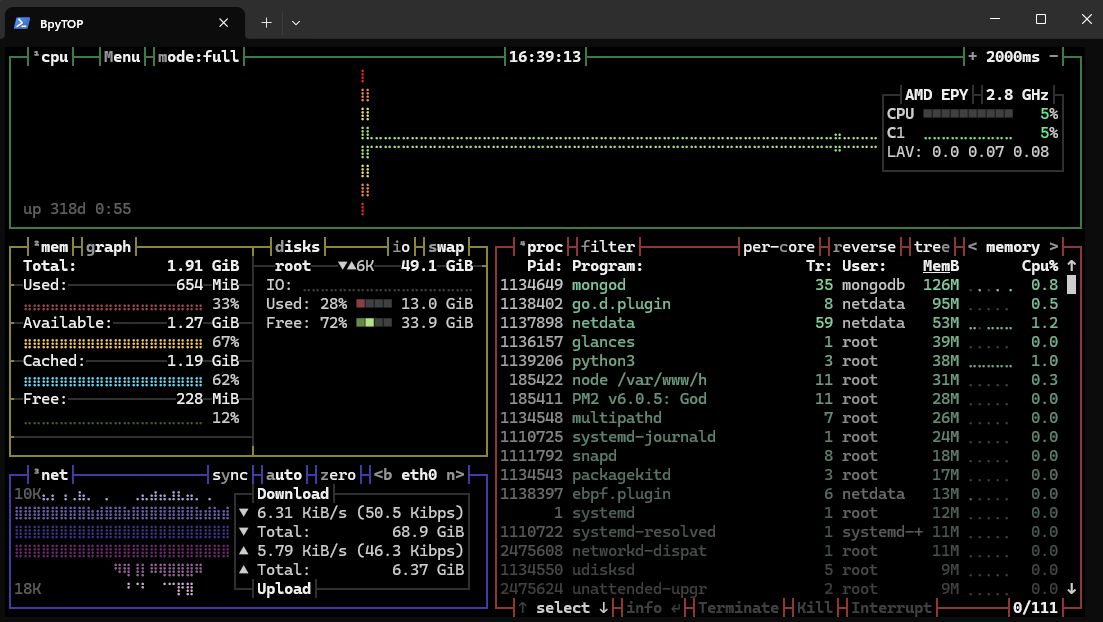
It's similar to btop but built with Python. Pressing the first letter of each title displays the information in a different format.
5. Bmon
Instead of just showing IP connections, it displays real-time bar graphs of incoming and outgoing traffic for each network interface (Ethernet, Wi-Fi, Docker bridges).
Best feature: It lets you view traffic spike history. If your server experienced lag 10 seconds ago, Bmon will show you the spike in the graph.
To install and use it, follow these commands (on Debian/Ubuntu):
sudo apt update
sudo apt upgrade -y
sudo apt install bmon
bmon
After running the bmon command, the tool will open:
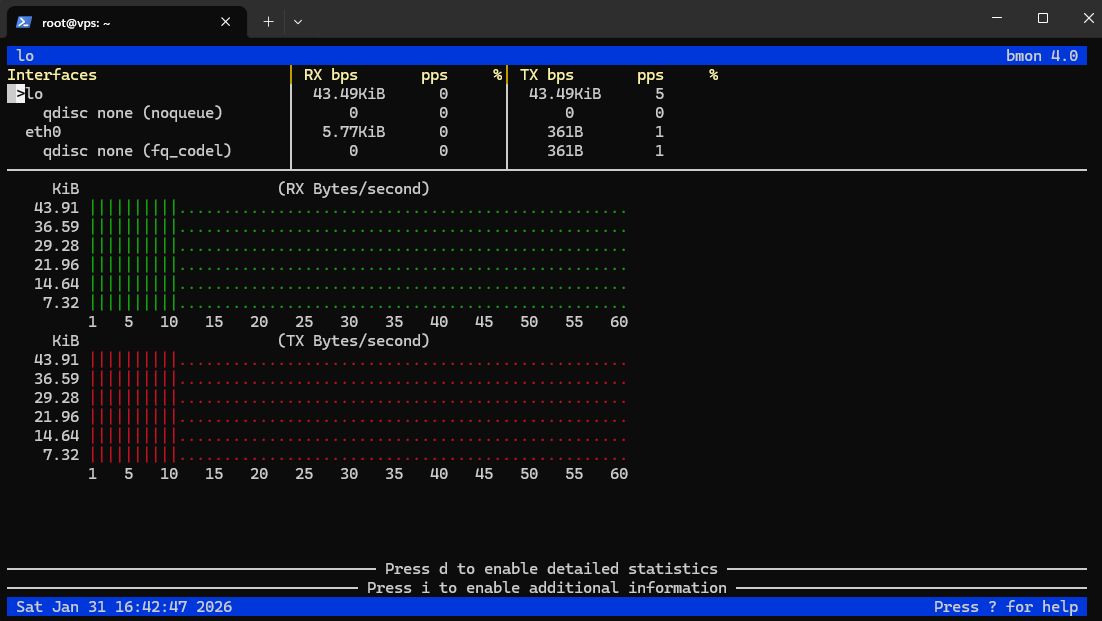
You can filter processes simply by typing the name while the program is running, and send termination signals (SIGTERM, SIGKILL) with a click.
To conclude
I personally recommend btop and bpytop because they're more visual and provide more information. When you're dealing with hacking, VPS outages, DDoS attacks, and other problems, it's good to always have the data on hand.

If you want to be even more vigilant, install web monitoring systems that are available 24/7. This way, you can always see the information in your browser.
[story continues]
tags