
I am a chronicler. I have a FitBit that records my overall health, which includes my steps, calories burned, heart rate, and sleep patterns of each day. I log my weight and everything I eat on MyFitnessPal. I also record my purchases and employment opportunities on a spreadsheet. It makes sense for such a recorder to also log grades received and the times spent on activities, studying, planning, job hunting, and work.
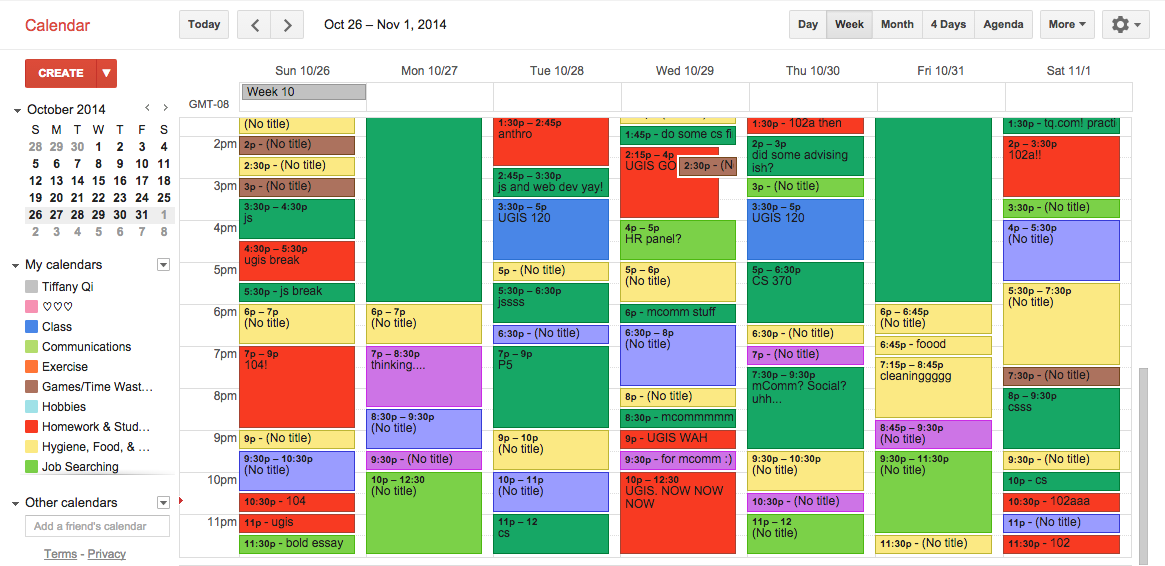
When I was a student at UC Berkeley, I recorded the exact percentages of the grades I received in each of my classes from each assignment as much as possible. I also began a calendar diary in December 2012, inspired by James Maa’s Productivity Hacking Guide. My calendars and event descriptions detailed when I went to sleep, took a shower, ate, or worked. I turned it into a way I could boost memory and track overall productivity. Now, I can go back to any given day and sum up all of the feelings I had that day; even though I have a poor declarative memory (episodic). So far, I’ve logged over 10,000 instances of time data, equating to almost four years of history. I don’t plan on stopping.
As a result of the data I’ve accumulated over my whole college career, I created a Productivity Project that touched upon some points I was interested in, which were:
- Time: how a student’s grades and academic time commitment change over time,
- Academic Correlation: whether time spent, units, specific tests, or class size and the grades received in the class have any correlation,
- Non-Academic Correlation: whether time spent having fun, sleeping, activities, planning, and job hunting affects GPA,
- Deflation: and whether grade deflation is really a concept at Berkeley.
You can view the longer full analysis and background there, but I’ll share the summary of my findings here.
DISCLAIMER: My findings here worked for me, but they may not work for you. Proceed with caution.
Findings
Time: How does a student’s grades and academic time commitment change over time?
The amount of time I spent productively throughout the years looked like a bell curve: I peaked my junior year in Fall 2014, and the lowest productive times were my very first and last semester. As I continued my beginning years, I became more motivated to work, but as graduation loomed closer, I spent less time being productive. My GPA also continued to fall consistently until my final semester at Cal.
The emphasis I place in certain productive categories depended highly on what period I was in my life. My first semester (Fall 2012) was all about figuring out how Berkeley classes and grades worked, and spent most of my time studying. My first semester junior year (Fall 2014) was all about how to spend time for the most good, and spent most of my time on activities. My final semester (Spring 2016) was all about how to not fail my classes so I could graduate and get a full-time job, and spent much of my time job hunting and studying. My GPA was the highest my first and last semester most likely because that’s when I was paying attention to doing well without underestimating anything.
Senioritis happened to me. Not in academics, studying, or preparing for jobs, but through my organic decrease in activities. While I reasoned this to weaning out of organizations to make way for new members, it also represented my lack of motivation and the increased stress with graduation requirements and job hunting.
I went through college in periods, and the category I spent the most time in showcased where I was in my life. Gradually, I grew more excited to leave this university, and thus my productive time slowly decreased when that thought loomed overhead.
Academic Correlation: Are grades received correlated with time spent, units, test scores, and class sizes?
I wanted to determine once and for all whether or not these factors were related to each other in some way. Did more studying result in a higher score? Does going to class or office hours result in higher grades? What about units or class sizes? I tackle each piece in my project. The following are answers to big questions I was interested in.
- Does the time spent on academics relate to the grade you get in the class?: Surprisingly, the time I spent studying, going to class, and going to office hours and the grade actually received did not exhibit any sort of pattern. However, this is likely because classes are bimodal: some classes require lots of studying (because I don’t get the material, and thus don’t do as well) and others don’t need studying (because I already get the material, and thus do well). This also applies to studying for tests. Check out the graph.
- Can you improve in the class if you do poorly in the beginning?: The good thing is that it appears the final test is a very strong influencer in the grade you get at the end. The bad thing is that there is a moderate positive correlation between the first and last test, which suggests that doing well on the final after doing poorly on the first test is very difficult to do (but still possible!). Check out the graph.
- If a class has more units, does that mean I have to spend more time in the class? (e.g. 4 units requires 16 hours a week of time): There’s a moderate positive linear correlation, which does suggest that the more units a class is, the more time you’d need to spend on it. Since it’s only moderate, it really depends on the class and potentially your understanding of the material itself. Check out the graph.
- Does class size have an impact on grade received?: There’s a moderate negative linear correlation between the two, which suggests that the more people in the class, the higher tendency it is to not do so well. Check out the graph.
Non-Academic Correlation: Are grades received correlated with fun, sleep, and activities?
Next, I tackled factors that were not related to the class itself, but factors that students could choose throughout the semester, such as how much they wanted to have fun, sleep, participate in extracurricular activities, plan, and job hunt. The following are answers to big questions I was interested in.
- Does spending time unproductively result in lower results?: While correlation does not imply causation, it does appear that more time on fun does lower grades in some way. Check out the graph.
- Does having a significant other lower productivity and grades?: Yes and no. When relationship data was removed, it appears to have strengthened the correlation between fun and academics and fun and GPA, but weakened in workload. This may be because my significant other was able to help me in some of my classes, and the time we spent hanging out were also times where we would work together as well. This also may be because I started dating near the end of my college career, in which I was already familiar with how to college. Check out the graphs.
- Does “work hard, play hard” actually hold true?: Yes, and no. It appears that I took fewer units when I had more fun, but I also spent more time on fun while also spending more time on academics. Again, these are all moderate correlations, and only when I did not have my relationship. With my relationship, these numbers were stronger mostly. Check out the graphs.
- Does the amount of sleep you get have a relationship on the grade received, productivity, and workload?: There’s no linear correlation between sleep and workload, or sleep and productivity. However, there does appear to be a moderate positive correlation between sleep and the grade received! Check out the graphs.
- Are activities a good use of my time?: Definitely. Despite the fact that activities and workload, productivity, and grades are all strongly negatively correlated, activities made me feel better and have more fun. Check out the graphs.
- Is planning a good use of my time?: There doesn’t appear to be a linear correlation between the amount I planned and my GPA, so it didn’t hinder me in any way. Check out the graph.
- Is job hunting hindering my grades?: There’s a strange weak positive linear correlation between job hunting and the grade received. I don’t really know what this means, but it is what it is. Check out the graph.
Note: I also recorded categories such as exercise, cooking, eating, and moving, but exercise was such an embarrassing small category, and everything after was clumped into one, and thus all were ignored in this analysis.
Grade Deflation: Does it exist?
At UC Berkeley in particular, grade deflation is a major worry. After seeing the Daily Cal‘s data on the higher average grades over other schools, it appears that Berkeley frequently gives lower grades than other schools across the nation. I sought to study this by comparing my grades received to the percentages that I actually received at the end of the semester, and compared predicted raw scores to that grade. For example, I assumed that a 3.0 (B)’s percentage range would be between 80% and 85.9%, while a 3.7 (A-) would be between 90% and 91.9%.
After plotting the data, the majority of my grades received were frequently higher than the percentages awarded, not lower. This suggests that professors reward higher grades depending on the averages of the class, which seems to suggest that there is no grade deflation. Check out the graph on my project’s “deflation” section.
What helped me stay on track in terms of where I was in the class was to record my grades and averages of the class, while keeping in mind my position near the mean. If the average was a B+ according to ScheduleBuilder and I was close, then I figured I’d get a B+, even if my raw percentage was a 70%. As a result, I was rarely surprised at the grade that I received.
Something to keep in mind is that we’ve also discovered that class size and grade have a moderate negative linear correlation. In the grade deflation article, UC Berkeley is compared with the likes of Harvard and Stanford, both of which boast low faculty to student ratios. Perhaps the reason for their higher grades is because they have consistently lower class sizes than UC Berkeley’s.
There are a lot of different factors at play when it comes to the final grades: how much time you sleep, have fun, study, go to class, test scores, etc. However, it is important to note that most likely it will not just be one of these factors that make or break your grade. They’re all important and work together to present your results at the end.
Here are some recommendations I’ve found from this analysis, and perhaps you’d find them helpful:
- Senioritis is bound to happen. Be wary of this so that nothing comes up to surprise you!
- Confidence is important for successful academics. When you’re nervous about a class and prepare in advance, being able to stand on equal footing as other classmates and feeling confident about your progress and achievement is half the battle. Do as much as you can to be confident in your classes, and if this is to study beforehand or study like crazy for the final, do it. (Even if it doesn’t have a correlation with the outcome.)
- Regardless of how much the final assignment is weighted, your performance on that is surprisingly telling towards how you will do in the class as a whole. Some classes use that result to curve your grade heavily, even if that assignment was only worth 10%. Do not underestimate it. For the most part, however, one assignment is not your whole grade, so do not worry if one grade wasn’t too good.
- Do what you love. While activities and work appear to be the reason why my grades were low, I wouldn’t choose to participate less simply for these reasons. I gained so much and loved what I was doing that grades were not a huge motivation for such a decrease.
- The time you spend studying and what you actually get at the end of the semester actually vary widely. Be sure to study until you understand the material, not bang your head against the wall and pretend to be studying (I promise, this doesn’t help).
- While there’s no correlation between grades and factors such as time spent planning, job hunting, and dating; it’s important to keep other factors such as sleeping and studying consistent to produce good results. So definitely keep the first factors at moderation, and keep sleeping and studying normally.
- Recording your assignment/test results and the averages of those help keep you on track to the grade you think you’d receive. It will also keep you from worrying about grade deflation.
- Just because there’s a strong correlation between two factors, doesn’t necessarily mean you will have the same outcome, or that one semester or one class will definitely fit that pattern. (Correlation does not imply causation!)
What do you think about this data and the conclusions I’ve presented here? I encourage all comments and look forward to an open discussion. Feel free to contact me if you’re interested in playing around with the data more deeply, as I am not an experienced data analyst. If you have similar data, I would love to compare and contrast with you, and would highly recommend everyone to try their hand at recording. You never know what would come of it!
Edits and Updates
- 1/30/17: I presented these findings to a QS Meetup, and while preparing it, I realized that there was some information that was misinterpreted.
- 2/5/17: Here are the findings that I’ve edited. Added class size as a potential reason for grade deflation comparisons. Added correlation does not imply causation in final recommendations. Removed factors that have a correlation and those that don’t, and restructured it to answer key questions instead. Discovered that units and grades, and extra time and grades don’t have a linear correlation. Class sizes and grades actually do have a moderate negative linear correlation, so I added that back in. Edited that the “work hard, play hard” mentality is half-half. Dating does have some sort of influence with productivity, and job hunting and grades actually has a weak positive linear correlation.
- 4/7/18: Edited the links to link directly to the graphs.
[story continues]
tags