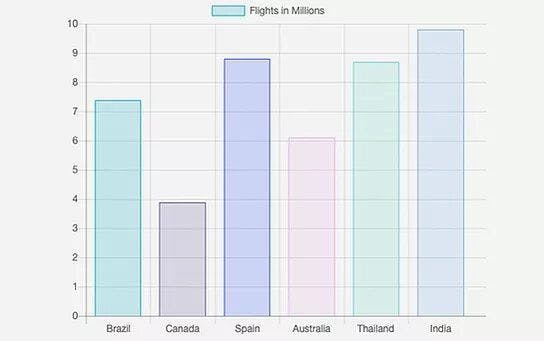
Example Code
let year = 2017;
let flights = {
	2014: [6.3, 2.4, 7.6, 5.4, 9.9, 7.8],
	2015: [6.7, 2.2, 11.2, 5.5, 10.1, 7.9],
	2016: [7.2, 3.1, 8.2, 5.6, 9.2, 10.2],
	2017: [7.4, 3.9, 8.8, 6.1, 8.7, 9.8]
};

$w.onReady(() =>{
	$w("#html1").postMessage(flights[year]);
	$w("#html1").onMessage((event)=>{

		if(event.data.type === 'ready'){
			$w("#html1").postMessage(flights[year]);
		}

		if(event.data.type === 'click'){
			$w("#clickedMessage").text = `The number of flights to ${event.data.label} in ${year} is ${event.data.value} million.`;
			$w("#clickedMessage").show();
		}
	});
});

export function year_onChange(event) {
	year = $w('#year').value;
	$w("#html1").postMessage(flights[year]);
}$w.onReady(function () {
//TODO: write your page related code here...
});How We Built It
element, the page sends a message to the HTML component using the
postMessage function. The message contains the values to display in the
chart. The HTML component receives the message using its onMessage
function and updates the chart accordingly.
- Open this example in the Editor to work with the template.
- Publish the site.
- Learn how to work with examples in Velo.


