
Table Of Links
6 COMPARING THE STATE-OF-THE-ART AND THE PRACTITIONERS’ PERCEPTIONS
8 CONCLUSIONS AND ACKNOWLEDGMENTS
3 RESEARCH DESIGN
Based on our main goal introduced in Section 1, we formulated the following research questions.
RQ1 Which MCR themes have been investigated by the research community?
RQ1.1 How was the research on MCR conducted and in which context?

RQ1.2 What is the quality of the conducted research?

RQ1.3 Which were the most investigated MCR themes and what were the major findings of the MCR research?
RQ2 How do practitioners perceive the importance of the identified MCR research themes?
RQ3 To what degree are researchers and practitioners aligned on the goals of MCR research?
To answer these questions, we followed a mixed-methods approach. We conducted a systematic mapping study to answer RQ1 and its sub-questions. In our previous study [4], we presented preliminary results of the mapping study with the review period until 2018. To answer RQ2, we created statements representing the primary studies’ research objectives. We then created the survey questionnaire using the statements representing the primary studies until 2018. We conducted the survey using the Q-Methodology, collecting practitioners’ opinions on the importance of the statements representing the MCR research topics.
We extended the mapping study period to 2021, analyzed the new primary studies (2018 onwards), and mapped to the statements representing them. Finally, we answer RQ3 by comparing both the frequency and research impact of MCR research with its perceived importance by practitioners. The research design is depicted in Figure 2. All research material we produced in this study (search results, selected primary studies, data extraction, evidence briefings, survey material, and citation analysis) is available online [5, 6]. In
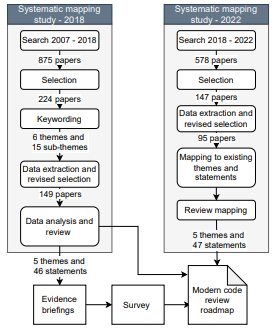
the remainder of this section, we illustrate the research methodologies we employed to answer our research questions.
3.1 Systematic mapping study
We followed the guidelines for conducting systematic mapping studies by Petersen et al. [32], which include the following steps: (1) definition of review questions; (2) conduct search for primary papers; (3) screening relevant papers; (4) keywording of abstracts; (5) Data extraction and mapping of studies. As seen in Figure 2, the systematic mapping study (SMS) was conducted in two phases: one study until the review period 2018 (SMS2018) and another from review period until 2021 (SMS2022).
The review questions are represented by the sub-questions RQ1.1, RQ1.2, and RQ1.3. Below we provide details on the execution of the consolidated mapping study (including the initial (SMS2018) and extend mapping study (SMS2022)). Search. Databases: The following databases were selected in SMS2018 and SMS2022 studies based on their coverage of papers: Scopus, IEEE Explore, and ACM Digital Library. Scopus indexes a wide range of publishers such as ScienceDirect and Springer.
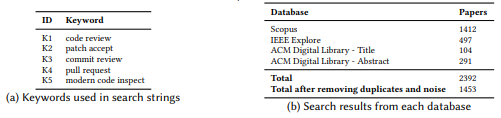
Search Strings: We used the keywords listed in Table 3a to search in the three databases, using the search strings shown in Table 4, combining each keyword with a logical "OR" operation and adding a wildcard (*) operator. We intentionally did not include the term “inspection" due to its association with traditional code inspections, which researchers have reviewed in the past (see discussion at the beginning of Section 2.3).
Search Scope: The search results, including SMS2018 and SMS2022 studies, are presented in Table 3b. In order to consider full years results we included papers until the year 2021 in the SMS2022 study. All the search results were exported into a csv file. We identified duplicates using Microsoft Excel’s conditional formatting and applying the duplicate values rule to all the titles. We manually checked the formatted duplicate entries before removing them from the list.


Selection. The search results were reviewed based on a defined set of inclusion and exclusion criteria (Table 5).
SMS2018 Selection: Before we started the selection process, we conducted a pilot selection on randomly selected papers from the result set. All three authors performed an independent decision on whether the paper should be included, excluded or tentatively included (we decided to be rather inclusive and exclude a paper later based on reading the full text). During the first pilot on 20 papers, we noticed a paper on test case review. We refined the inclusion criterion I2 (see Table 5) to add test code review as well. Some papers discussed approaches to support the MCR process to make it more efficient, for example, by selecting a relevant reviewer. Therefore, we added a specific inclusion criterion related to the MCR process (I4).
As one of the goals of our study is to understand practitioners’ perception on MCR research, we decided to only include studies focusing on MCR practice (including open source). Therefore we excluded papers that discuss MCR in education (E3). We modified exclusion criterion E1 to emphasize the subject of the investigation, i.e. we only include papers where the process of MCR is under investigation. We also came across papers that discuss solutions that might benefit, among other things, the MCR process, without discussing the implications of the approach on the code review process itself (e.g., defect prediction).
As a result, we excluded such papers and added exclusion criterion E2. We conducted a second pilot study on 20 additional papers using the revised criteria. As a result, we achieved better understanding of the selection criteria. We decided therefore to distribute the selection of the remaining papers among all three authors equally. In cases where more that one version of a paper was available (e.g. a conference paper and a journal extension), we selected the most recent version.
SMS2022 Selection: After conducting the survey, we extended our mapping study. We conducted another pilot study on 30 random studies to evaluate if our selection (inclusion/exclusion) criteria
need updating. We were consistent to a large degree in the pilot study and found we were able to make the selection based on our initial selection criteria. Out of 30 papers, we disagreed on six papers. By disagreement, we mean that one of the authors decided to exclude the paper while the other author included the paper. We agreed to revisit the papers before making the final decision. After revisiting the papers, we eventually decided to exclude them. We divided the remaining papers and continued the selection process independently.
Keywording. SMS2018 Keywording: The goal of keywording the abstracts is to extract and classify the main contribution of the selected primary studies. We performed the keywording during the selection process. The keywording process resulted in a preliminary grouping into six main, and 15 studied sub-aspects in MCR research, published in our previous work [4]. The result of the keywording process was used to create initial themes and to identify extraction items.
SMS2022 Keywording: We used the identified themes in the SMS2018 study to classify the primary studies in SMS2022; therefore, we did not need any keywording process.
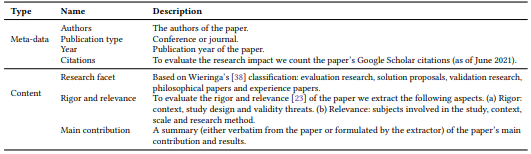
Data extraction. We extracted the data items shown in Table 6 in both mapping studies.
SMS2018 Data extraction: We used the preliminary results (studied aspects in MCR research) as an input to extract additional items related to the main contribution of the primary studies. For example, we extracted the "techniques used" and "purpose" in papers providing tool support and the "techniques used" and "selection criteria" as additional extraction items for papers providing reviewer recommendation support.
Similar to the paper selection, we planned to distribute the data extraction work among the three authors of this paper. Hence, to align our common understanding of the data extraction form, we conducted two pilots. Data extraction pilot 1: Before starting the pilot process, we reviewed the rigor and relevance criteria provided by Ivarsson and Gorschek [23]. Assessing the research method in the relevance dimension of primary studies that analyse repositories was not straightforward.
For evaluating the relevance of the research methods, we agreed that the tools/solutions or findings from primary studies should be validated or evaluated by the users in the field to get a high score. Results based on solely analyzing repositories are not enough; other sources such as interviews/surveys should be conducted. Once we had an understanding of the criteria we piloted the extraction process using six primary studies where each author independently extracted the data. All the extracted items were consistent among the authors, except for the type of the subjects in the relevance, and study design in the rigor dimension.
For study design, the extracted values were different for one paper and the difference was resolved in a meeting. For the type of subjects, we decided to give 0 to subjects if no subjects are involved or if the main findings of the paper are not discussed with any subjects. It is important to evaluate the relevance of the findings with users involved in code review; therefore, we give a high score when subjects are involved to corroborate the findings. We calculated the inter rater agreement (IRA) for each of the rigor and relevance aspects. For pilot 1 the average IRA for all aspects was 82%. Data extraction pilot 2
Based on the updated description of the rigor and relevance criteria, we conducted another pilot study on 11 papers. In the second pilot study, there was higher agreement in the extracted items. In particular, the inter rater agreement for relevance of subjects was increased considerably. For pilot 2 the average IRA for all aspects increased to 88%.
After piloting the data extraction, we divided the data extraction of included studies until year 2018 with 20% overlap among the authors. The average IRA between the first and second authors was 95%, and 86% between first and third author. For the second and third author the IRA was 75% however, this low percentage is mainly due to a conflict in one paper.
SMS2022 Data extraction: We used the same extraction form as in SMS2018. We independently conducted the extraction of the studies identified in SMS2022 as we had a good understanding of the extraction items.
Data analysis. SMS2018 Data analysis: Using a deductive approach, we used thematic analysis [17] to categorize the primary studies into themes. The main contribution extracted from the primary studies was used to generate themes. For example, if the paper’s main contribution is to provide solution support for reviewer selection then we assign the paper to the "solution support" theme.
We divided the primary studies based on the studies aspects identified in the keywording process among all three authors to generate themes. For example, the first author identified themes for all the primary studies related to the MCR process and studies investigating source code and review comments. The second author identified themes within the primary studies providing tool support, and finally, the third author analyzed the primary studies providing reviewer recommendations.
We then followed a review process where two other authors reviewed each paper classified by one author. Based on the discussions in the review process, we moved the primary studies into different themes when needed. This process continued until all three authors reached a consensus.
SMS2022 Data analysis: We mapped the contributions of the primary studies identified in SMS2022 study to existing themes. All authors were involved in the mapping process. We reviewed the mapping process to ensure that the mapping was done fairly and not forced into existing themes.
Evidence briefings. Evidence briefings are a technology transfer medium that summaries the research results in a practitioner-friendly format [12]. We created evidence briefings based on the main findings of the primary studies identified in SMS2018. We provided the link to the evidence briefings at the end of the survey allowing the practitioners to read more on the themes that they find most interesting. The evidence briefings are available online [5] 2 .
3.2 Q-Methodology survey
We chose Q-Methodology as a data collection and analysis approach since we were interested in understanding the viewpoint of practitioners on the numerous modern code review research topics we have identified in our mapping study. Q-Methodology allows to collect viewpoints on concepts that might share underlying common factors, and that are brought to the surface by revealing relations between concepts instead of rating these concepts in isolation [8]. The factors are identified by analyzing the subjective opinions of individuals, not facts, revealing common viewpoints within the surveyed community [9]. A strength of the Q-Methodology is that it can provide insights on the matter of study with a relatively low number of respondents, compared to conventional surveys [19]. Q-Methodology consists of the following seven steps [41]:

(1) Defining the concourse: The concourse consists of all the statements on a particular topic, which is in our case, modern code reviews. In our systematic mapping study, we have extracted the primary study’s main contributions and research objective to represent the concourse.
(2) Defining the Q-Set: The Q-Set is a sample of statements drawn from the concourse. These statements are formulated in a way such that it is possible to form an opinion about the content of the statements. The statements should not be factual, i.e. should not present a truth such as "the earth revolves around the sun", but rather evoke agreement or disagreement. Using our mapping study (SMS2018), we formulated statements from the papers’ research objective in the form of "It is important to investigate ... [research statement]".
We consolidated overlapping research objectives into single statements, i.e. the number of statements (46) < number of primary studies (149). All authors were responsible for creating the statements from the primary studies in SMS2018. In a review process we revised the mapping whenever necessary. We followed the same mapping process for the primary studies identified in SMS2022. We list the statements and the frequency we encountered the corresponding research objective in our mapping study in Table 7.
(3) Defining the P-Set: The P-Set represents the survey participants. We sent the survey to practitioners in our professional network who are involved in software development and the code review process. We sent the survey link to our contact persons in 17 partner companies, who distributed the survey within the company. In addition, we published the survey link on our LinkedIn profile. The participants (P-Set) rank the statements (Q-Set) on a scale of +3 to -3 representing their agreement level. The details on the P-Set, i.e. the demographic information of participants is provided in Table 8.
(4) Defining the Q-Sort structure: The participants were asked to place a certain amount of statements in each rating. The number of statements that can be placed in each rating is shown in Figure 3. For example, the participants can file 9 statements into the rating +1 and -1 rating respectively.
(5) Conducting the Q-Sorting process: In this step, the participants in the P-Set rate the statements in Q-Set. We adapted an existing tool [11] that implements the Q-Sort in a web application. After we piloted the tool with three industry practitioners, we improved the tools user interface and description of steps. The updated tool3 and the survey4 , consisting of four steps, can be accessed online. In step 1, we provide an introduction to the study purpose so that the participants are aware of the importance of their input.
In step 2, we ask the participants to place the statements in agree, disagree and neutral piles. In step 3, the participants place the statements in the Q-Sort structure depicted in Figure 3. In this way, the participants read the statements two times; once when they put them in the agree/disagree/neutral piles and then when they file them into the Q-Sort structure. In step 4, we ask the participants to provide explanations for the placement of the six statements that they filed in the extreme agreement (+3) and disagreement (-3) piles.
(6) Conducting Factor Analysis: In the analysis, all similar viewpoints are grouped into a factor. Q-Methodology automatically classifies the viewpoints and provides a list of statements along with z-scores and factors scores for each factor. In other words, a list of statements that differentiate a viewpoint is generated along with the scores which indicate how the viewpoints differ. We elaborate on how the factors are generated in Section 5.3.
(7) Conducting Factor Interpretation: This last step refers to the interpretation of the factors by considering the statements and their scores in that factor and the participants’ demographic information. All the statements in each factor along with the ratings were reviewed to understand the nuances of each viewpoint (factor). The first author formulated interpretations of each factor, considering the participants explanations for the statements rated with high agreement and disagreement. The interpretation was then reviewed by the second and third author. The review process resulted in minor reformulations. The factor interpretation is provided in Section 5.3.
Authors:
- DEEPIKA BADAMPUDI
- MICHAEL UNTERKALMSTEINER
- RICARDO BRITTO
This paper is
[story continues]
tags