In this article, I’ll explain how Precision, Recall, F-score, and ROC-AUC are calculated, with real examples.
We’ve already figured out that many model-quality metrics are derived from the Confusion Matrix, while Accuracy is used rather rarely (even though it’s very popular among clients who don’t really understand machine learning). So, what else can we calculate based on this matrix?
Precision & Recall
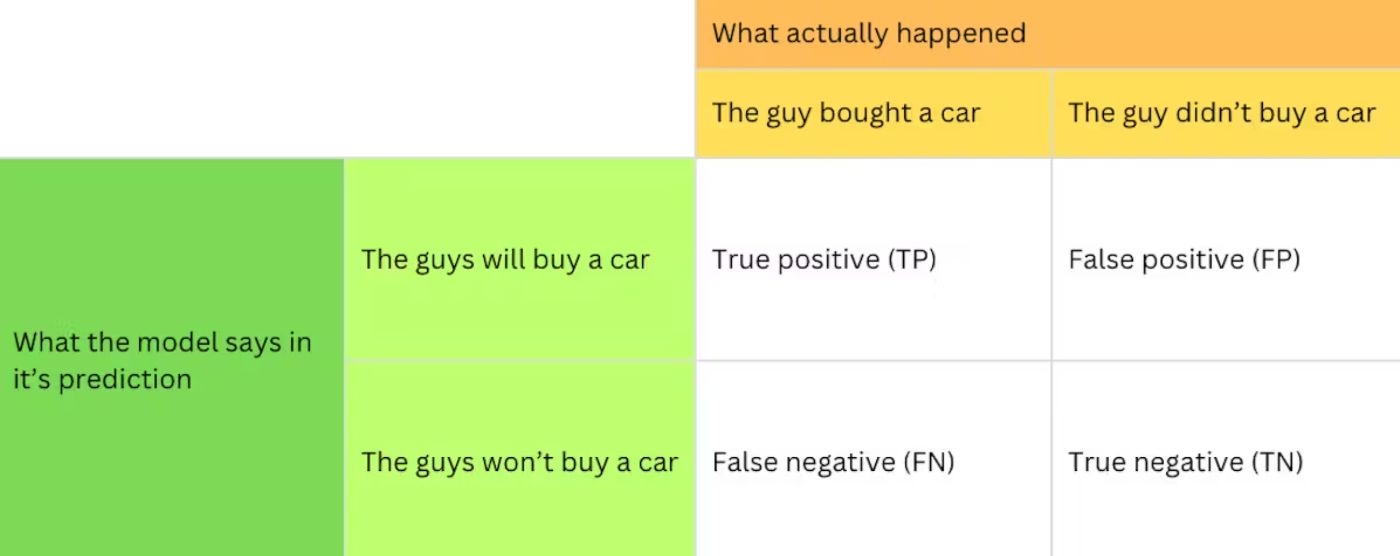
Precision = TP / (TP + FP)
Precision shows the share of objects the model marked as positive that are actually positive.
Recall = TP / (TP + FN)
Recall shows what portion of all true positive-class objects the algorithm managed to find.
These metrics reflect model quality more accurately than Accuracy, but they also have some drawbacks. For example, you can change both of them simply by shifting the probability threshold for class assignment.
F-Score
Sometimes, all these metrics can get confusing, and machine-learning algorithms are usually built so they optimize just one specific quality metric. That’s why people came up with metrics that reflect both Precision and Recall at the same time — these are called F-scores. There are several types of F-scores, but here I’ll explain the most basic one, the F1 score:
F1 = 2 * (Precision * Recall) / (Precision + Recall)
So, F1 shows both how well the model finds positive-class objects among all true positives, and what share of the objects the algorithm labeled as positive are actually positive.
ROC-AUC
Probably the most popular metric for binary classification is ROC-AUC. It doesn’t depend on choosing a probability threshold and works well on imbalanced datasets. Let’s break down how it’s computed step by step using a simple example about buying an elephant.
Say we have 10 people; 4 of them will buy an elephant, and 6 will not. Our model predicts the probability of buying an elephant for each person.
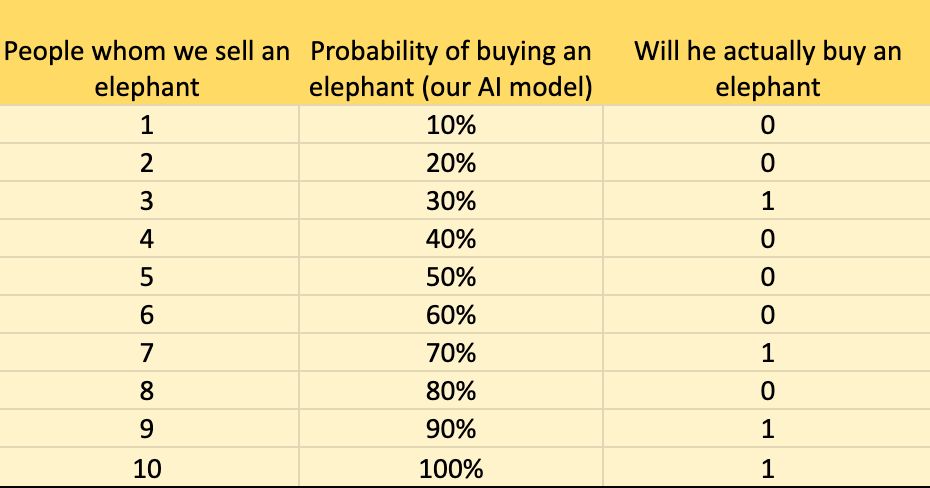
We now have each person’s buying probability and the actual outcome.
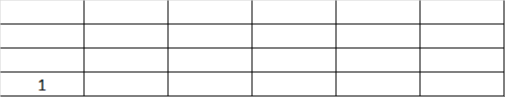
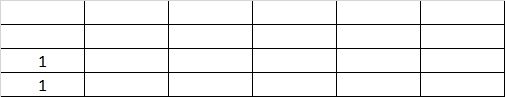
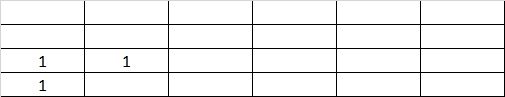
By counting the number of positive outcomes (there are 4) and negative ones (6), we draw a grid that is 4 cells high and 6 cells wide. Its total area is 24.
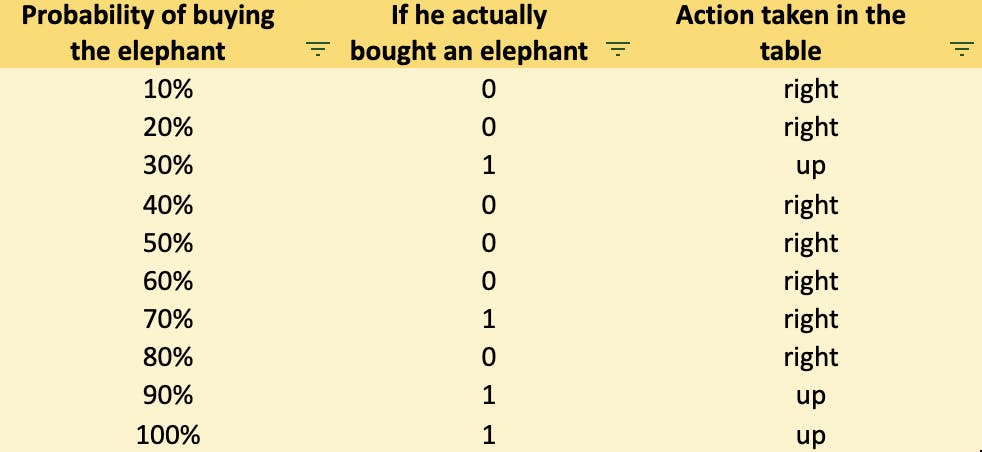
Next, we sort the probabilities from highest to lowest. Then we move through them one by one: if the person actually bought the elephant, we take one step up; if not, we take one step right. After finishing the actual sequence, we continue placing the remaining steps to the right until the grid is filled. Here’s what happens:
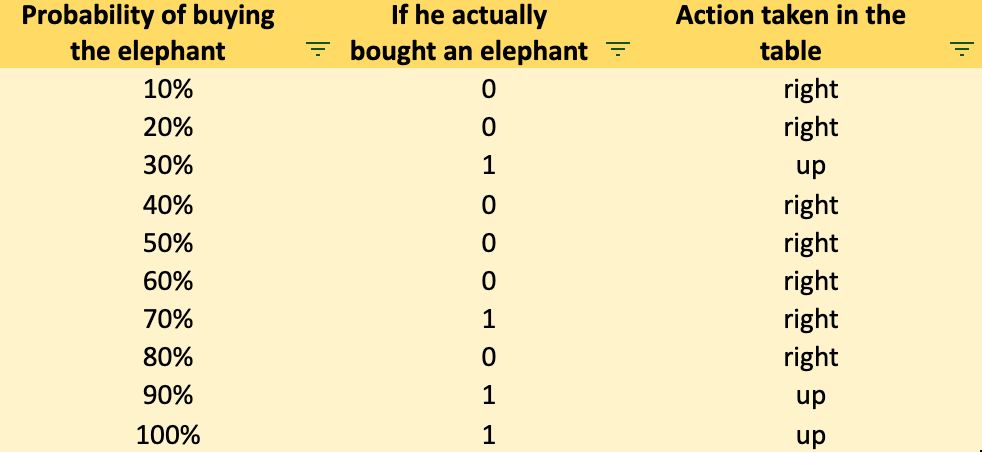
First step: Upward — the model predicted correctly (low probability of buying an elephant, and the guy actually didn’t buy it).
Second step: Upward again — another correct prediction (again, low probability of buying an elephant, and the guy actually didn’t buy it).
Third step: This time the model was wrong — we moved right (we have a low probability of purchase, but the man actually bought an elephant).
Fourth step: correct — we move up.
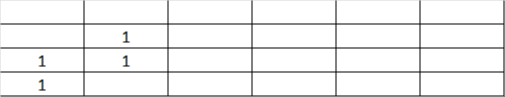
Following this logic, we fill the entire grid.
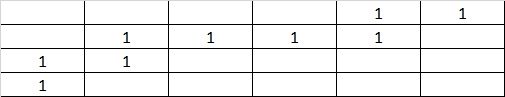
After placing all steps, we fill all cells below with 1.
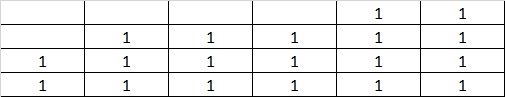
Then we count them: we get 19.
Now, we divide 19 by the total number of cells (4 * 6 = 24):
ROC-AUC = 19 / 24 = 79%
Conclusion
In the next article, I’ll continue with AI metrics and move on to regression metrics such as MSE, RMSE, MAR, R-squared, MAPE, and SMAPE.
Follow me — check my profile for links!
[story continues]
tags