If you haven't realized it yet, this is a crazy market!
However, beyond short-term volatility driven by liquidity and macroeconomic trends.
There are a few interesting takes from the latest financial releases of Google, Facebook, and Amazon.
Let's see some of them!
Google’s parent company, Alphabet, released its end-of-year financials. Looking at its financials is important for various reasons and some of them are:
- Assessing the digital advertising landscape.
- Understanding how Google’s advertising machine works at scale.
- How consumers’ behavior is shifting in this new digital landscape.
Let’s dive into them.
Google’s profitability
Google’s profitability has slightly improved in 2021, thanks to the fact it managed to increase its revenue faster than it increased its operational costs, as traffic on its platforms increased substantially during 2020-2021. We’ll see in this in-depth analysis why that’s the case.
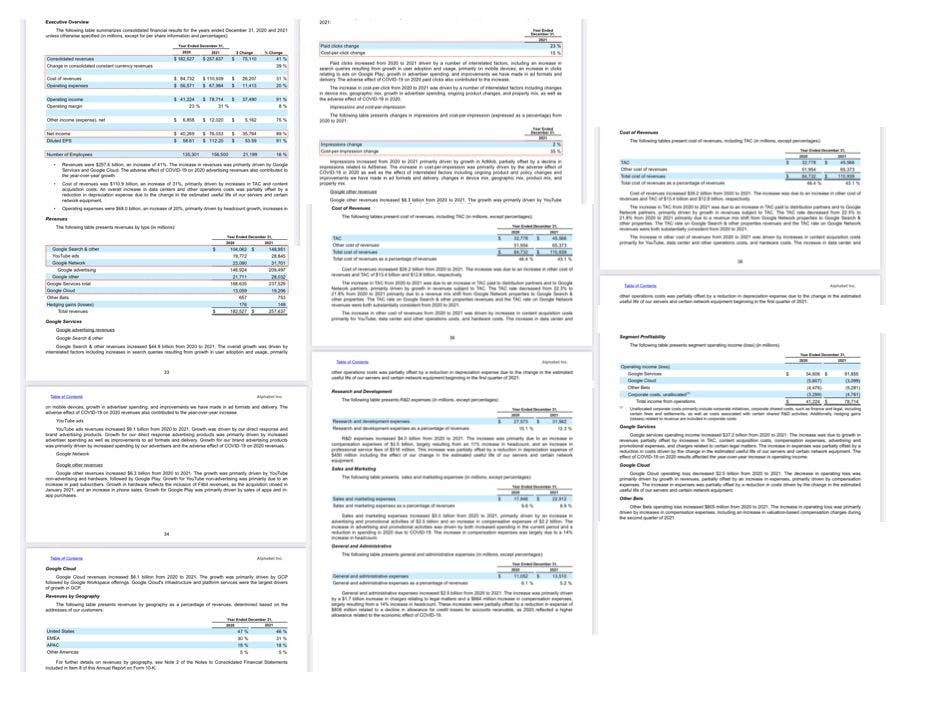
First of all, for the first time in its history, Google generated over $257 billion in revenues. And the company almost reached a two trillion market capitalization. For some context, when Google IPOed in 2004, it recorded almost a billion in revenues, and it was worth about $23 billion, as it popped at its IPO date to $85 per share (On February 2nd, 2022, a Google stock is worth $2,958.22).
At the time, in 2004, Google had just managed to scale its advertising machine comprised mainly of GoogleAdWords (today Google Ads) and Google AdSense. At the time the advertising machine was primarily based on Internet traffic from desktop devices. That was a completely different world.
As we’ll see throughout this analysis, today most traffic comes from mobile. And Google’s mobile ads platforms (Google AdMob) play a key role. So let’s dive a bit into the main financial segments of Google.
Google’s main segments in 2021
In 2021, the Google advertising machine, generated over $209 billion in revenues. This represented an over 42% growth, year over year! This is a massive improvement for a company worth almost two trillion. In a market landscape that is not anymore in favor of digital advertising. How did Google pull this off?
We’ll see this shortly. But for now, let’s emphasize a few key points.
- Google Search/Properties: This represents the set of products that Google owns, from the search engines to all the other vertical platforms that the company operates (Google Discover, Google News, Google Travel, and more). In 2021, this segment generated over $148 billion!
- YouTube: This is of course one of the most successful business acquisitions ever done. It was acquired by Google for $1.65 billion in 2006. It’s important to notice that Google was able to integrate YouTube and scale it up. A feat that not every other company would have been able to achieve. At the time YouTube was getting sued for various copyright infringements (the platform is comprised of user-generated content, often posting copyrighted materials) that would have most probably bankrupted it if it had stayed a startup without Google’s backing. By 2021, YouTube has become an advertising machine generating over $28 billion (this doesn’t count the YouTube memberships, which are reported separately).
- And Google Network Members’ properties: this is the set of publishers that decide to opt into Google’s advertising network (either AdSense for desktop, or AdMob for in-app advertising). Here Google shows advertising on the network members’ properties, thus splitting the revenues with them. In 2021, Google’s network members generated over $31 billion of revenues.
As we’ll see understanding the difference among these segments helps us understand how Google manages its cost structure for each segment.
What determines the growth of each segment?
- Google’s search advertising has been driven by growth in search queries. In fact, since the pandemic hit, more and more users started to use Google’s products. This trend has continued. However, most of it was driven by mobile users’ growth. This is an important aspect, as it shows that Google’s main driver of growth is based on mobile traffic. This changes the way the company needs to prioritize its product developments efforts, its ad formats served to users, and also how it experiments.
- YouTube growth was driven primarily by improved ad formats. This means that Alphabet (as it’s evident to anyone going on YouTube) has ramped up the advertising operations on YouTube. In short, on YouTube now there are way more ads than before. This “improved ad formats” is the result of YouTube’s extreme stickiness with users, which enables Alphabet to play with its ad formats.
- Google’s network members’ properties were primarily driven by AdMob. In short, the mobile advertising platform, powered up by Android devices through the Google Play store, was the main driver of revenue growth in 2021. This shows how Google has shifted also its focus on the mobile advertising platform.
Let’s see how, a little bit more in detail, ad monetization changed for Google.
In 2021, two main factors determined the improvement in ad monetization by Google.
First, Google recorded an increase in paid clicks (driven by an increase in user adoption and search queries primarily on mobile devices).
Second, this also drove more paid clicks in AdMob through the Google Play store.
Third, as we saw Google is testing various ad formats (we can argue it’s showing more ads) both on Google’s products and YouTube, which slightly improved monetization.
Among the other revenues, instead, Google Cloud also recorded an important growth thanks to the Google Cloud Platform.
Let’s look now at the other side, the cost structure.
Google’s cost structure
When it comes to Google its cost structure is pretty straightforward. In order to keep its operations profitable, it needs to be able to generate traffic at much lower costs, than it can monetize it.
In 2021, Google traffic acquisition costs (the spending needed to run the servers, for its main products, and the deals in place to enable the distribution for its main products) were over $45 billion.
In respect to advertising revenues, its traffic acquisition costs were 22% of its advertising revenues in 2020. In 2021, instead, the traffic acquisition costs decreased to 21.7% compared to its revenues.
This might seem a little difference. Yet, Google managed to lower its traffic acquisition costs, nonetheless its much wider users’ adoption.
This shows that a lot of that adoption was organic, and based on strong deals the company has in place.
The other cost of revenues instead was mainly driven by improved content acquisition costs and costs in data centers.
In terms of profitability, it’s interesting to notice, how, at a wider scale, Google Services has huge margins.
That’s because as we saw in the previous paragraph, Google managed to improve monetization for users, it saw mobile users’ growth, while it managed to lower its traffic acquisition costs!
This combination led to an improved marginality.
However, it’s also interesting to notice how the Google Advertising machine is the only one running at positive margins.
Where instead, both the Google Cloud platform and the other Google Bets run at negative margins. Important to distinguish here.
When it comes to the other bets those instead are breakthroughs that Alphabet is pursuing with a long-term perspective. Those are money-losing bets for now but might turn into something interesting in the coming decade.
- Google’s Alphabet has become a two trillion-dollar company in 2021. Back in the early 2000s, the company had started to build its advertising machine. This journey culminated in 2004 when the company had managed to put together the various pieces (Google AdWords and Google AdSense) of its advertising machine, thus scaling up its revenues on top of a growing search platform. Indeed, in 2004 Google generated almost a billion dollars in revenues, and it was worth about $23 billion as it IPOed. In 2021, the company passed the $257 billion mark!
- Among the biggest drivers of its revenues were the increased adoptions from users as the pandemic hit. This trend continues across 2020-2021. The increased search query traffic was primarily due to mobile users. Therefore, Google had to push more experimentations through its mobile platforms.
- YouTube, driven by mobile traffic growth saw also an important growth. Alphabet here pushed through more ad formats, and more advertising to monetize it further. Thus, taking advantage of the increased mobile traffic as a consequence of the pandemic.
- The above led to increased profitability, given the ability of Alphabet to reduce/or keep its costs stable as traffic increased. And yet its ability to keep monetizing the traffic through increased ad spending, but also by serving more ads on its platforms.
- Google ads platform remains the strongest segment of the company, with massive profitability.
- Google has negative margins on its Cloud Platform and its further bets. However, both play a critical role in the future (Google Cloud Platform in the next five years, while the other bets in the coming ten-fifteen years).
How much will Facebook (now Meta) lose as a consequence of Apple's policy change?
At least $10 billion in 2022!
This is for Facebook alone.
For some context, Apple now requires apps to explicitly ask users if they want to be tracked, while before the consent was given by default.
As Facebook highlighted in its latest financials:
"with Apple's iOS changes and new regulation in Europe, there's a clear trend where less data is available to deliver personalized ads...
...Like others in our industry, we faced headwinds as a result of Apple iOS changes...
...Apple created two challenges for advertisers: one is that the accuracy of our ads targeting decreased, which increased the cost of driving outcomes; the other is that measuring those outcomes became more difficult. These challenges are complex and interrelated. We're working to try and improve things..."
And they further explained:
"For example, by making progress in closing the underreporting gap for iOS web conversions and by introducing tools like our aggregated event measurement solutions to deliver better insights for advertisers..."
And finally, they put a number on it:
"And, you know, we believe the impact of iOS overall as a headwind on our business in 2022 is on the order of $10 billion, so it's a pretty significant headwind for our business. And, you know, we're seeing that impact, you know, in a number of verticals..."
Summing things up for the digital advertising landscape:
Some key highlights from the latest financials of Google (Alphabet) and Facebook (Meta) also show some of the changes in the digital advertising landscape. This, in turn, is affecting millions of small businesses across the world:
- The pandemic determined a mobile transition: while companies like Google and Facebook have been investing in mobile-first for years. In reality, it was the pandemic that accelerated the trend. For both Google and Facebook, mobile traffic is the only growth driver.
- An interesting note here: Google (thanks to its vertical integration) managed to monetize its increased adoption.
- Facebook, on the contrary, hasn’t, and this was definitely due to Apple’s privacy change.
- The supply chain of data: it’s crucial to understand how Google and Facebook are entirely different in terms of structure.
- Where Google is vertically integrated (Hardware/Android > Chrome/Play Store > Search Engine/Search Ads), Facebook primarily relies on its strong brands who benefit from stickiness (Facebook, Instagram, WhatsApp, Messenger, Oculus). While this played out well for Facebook so far. As soon as Apple tied up the distribution pipeline, it threatened the whole business!
- Stalled user growth of Facebook: for the first time users stalled in various regions across the world. This is because there is too much pressure from new social media platforms (TikTok is killing it).
- The move into the Metaverse becomes a survival anchor for Facebook: where Google’s growth potential has not been affected so far (it might come in the future), Facebook’s growth has already been affected. Thus, the move to the Metaverse for Facebook is not just a strategic bet; it’s a survival anchor! This means Facebook has to rush into it! Blitzscale the adoption of VR devices, which might turn into enormous mistakes.
Who might benefit? Let’s draw some key points:
- Accelerating VR adoption for Facebook: Facebook has to push into VR (Oculus is a first step there). But the vision of Facebook of VR is way more pervading than any other company as its survival depends on that.
- VR/AR wars coming in 2022: all tech giants are rushing into VR with different philosophies. Apple believes in augmented reality, Google believes in mixed reality. Facebook wants to bring us into the Matrix. Therefore, we’ll see the first VR headsets probably in 2022 as the first exploration toward AR.
- Contextual advertising might win over targeted ads based on tracking: digital platforms that go back to contextual advertising rather than aggressive targeting might benefit in this phase (Reddit over Facebook).
- Rise of privacy first search engines and social media: companies whose business model has privacy built-in will keep their growth trajectory. Thus, search engines like DuckDuckGo might skyrocket, and social media platforms like MeWe might thrive.
What about Amazon?
Some interesting takes from Amazon's financials as it closed the year. No wonder Jeff Bezos picked up Andy Jessy (the current CEO) as his successor. Andy Jessy has led AWS since its inception in 2003!
In Q4, Amazon online stores stalled compared to the previous year (hint: the pandemic contributed to the 2020 boost).
- The fastest-growing segments were AWS and Amazon advertising. Amazon's advertising machine passed $30 billion in revenues in 2021. For some context, YouTube ads generated over $28 billion in 2021.
- Amazon AWS showed incredible growth. A 40% growth year over year. Amazon AWS is a $71 billion revenue run rate business! And it has wide margins (so far) and incredible profitability, which connects to the next point.
- Of Amazon's over $33 billion in profits, over $18 billion were contributed by AWS! This means that more than 50% of Amazon's profitability depends on AWS.
- AWS is an enterprise powerhouse. Among its customers, there is also Meta! Meta, former Facebook Inc, relies on Amazon AWS for its AI development platform. Other huge brands built on top of Amazon AWS are Best Buy, Under Armour, Goldman Sachs, Pfizer, Roche, and many others.
Can you guess what's next?
Also Published Here