
Why this blog? To begin my exploration into recommendation systems, I laid my hands on the most obvious “Restaurant Recommendation” use-case. Nevertheless, in my journey of applying AI/ML to business problems, this was quite an experience on feature engineering, handling geospatial features, intensity of cold-start problems, dealing with extremely imbalanced data (only 1.5% positive classes) and experimenting with deep learning models for content filtering. I intend to document and share these learnings with a hope it will be helpful to ML practitioners.
Where does “restaurant recommendation” fit in? Food delivery services like Zomato, Swiggy partner with restaurants and connect them to its large customer base via its online ordering platform. It typically recommends restaurants to its app-users based on their proximity to customers’ location, prior food choices, ratings of the restaurants and its promotional offers. Customers can order food from multiple locations either from their home, office, friend’s place. Based on the customer’s location or zip-code, restaurants in the neighbourhood are listed to the app users.

Exploratory Data Analysis
Chosen data and its problem statement: The food service delivery data in Kaggle comprises customer’s and restaurant’s meta data. The objective is to build a restaurant recommender system leveraging this data and predict if a customer from a certain location had ordered via a certain restaurant vendor. The target is a binary outcome.
Customer Data
|
Analysis Outcomes |
So What? |
|---|---|
|
91% of train customers had ‘DOB’ missing and 99.9% customers had same ‘status’ value. |
These features were deemed not useful in customer profiling. |
|
Duplicate customer records were present as every update to the customer record was retained. |
Most recent records had the account status verified. Older records were removed. |
|
No overlap between train and test customer files!! |
This implied, model predictions were for new customers and model approaches to be adopted accordingly. |
|
19 train customer-locations and 9 test customer-locations had missing latitudes and longitudes. |
Imputed with mean coordinates of respective customer. |
|
877 train customers had only locations without demographic details |
Null treated as a valid category for the demographic features. |
De-duplication of customer demographic
Transform function in Pandas came in handy
# Check for duplicates
train_customers[train_customers.duplicated("customer_id")]["customer_id"].value_counts()

# Exclude chronologically older records
train_customers_dedup = train_customers[train_customers["updated_at"] == train_customers.groupby(["customer_id"])['updated_at'].transform('max')]
Geospatial analysis
-
Latitudes lie within a range of [-90,90] and longitudes in a range of [-180,180] degrees. Out of 59503 train customer-locations, 58169 of them were valid.
-
Using customer’s latitude & longitudes, city and country details were fetched using reverse_geocode python package. City and country info would help capture proximity aspects within customers.
import reverse_geocode
coordinates = list(zip(train_locations_valid["latitude"],train_locations_valid["longitude"]))
train_locations_valid[["country_code","city","country"]] = pd.DataFrame(reverse_geocode.search(coordinates))
-
Continent details were retrieved using pycountry_convert package
import pycountry_convert as pc country_codes = train_locations_valid["country_code"].dropna().unique() country_continent_map = {country_code : pc.convert_continent_code_to_continent_name(pc.country_alpha2_to_continent_code(country_code)) for country_code in country_codes} train_locations_valid['continent'] = train_locations_valid['country_code'].map(country_continent_map) -
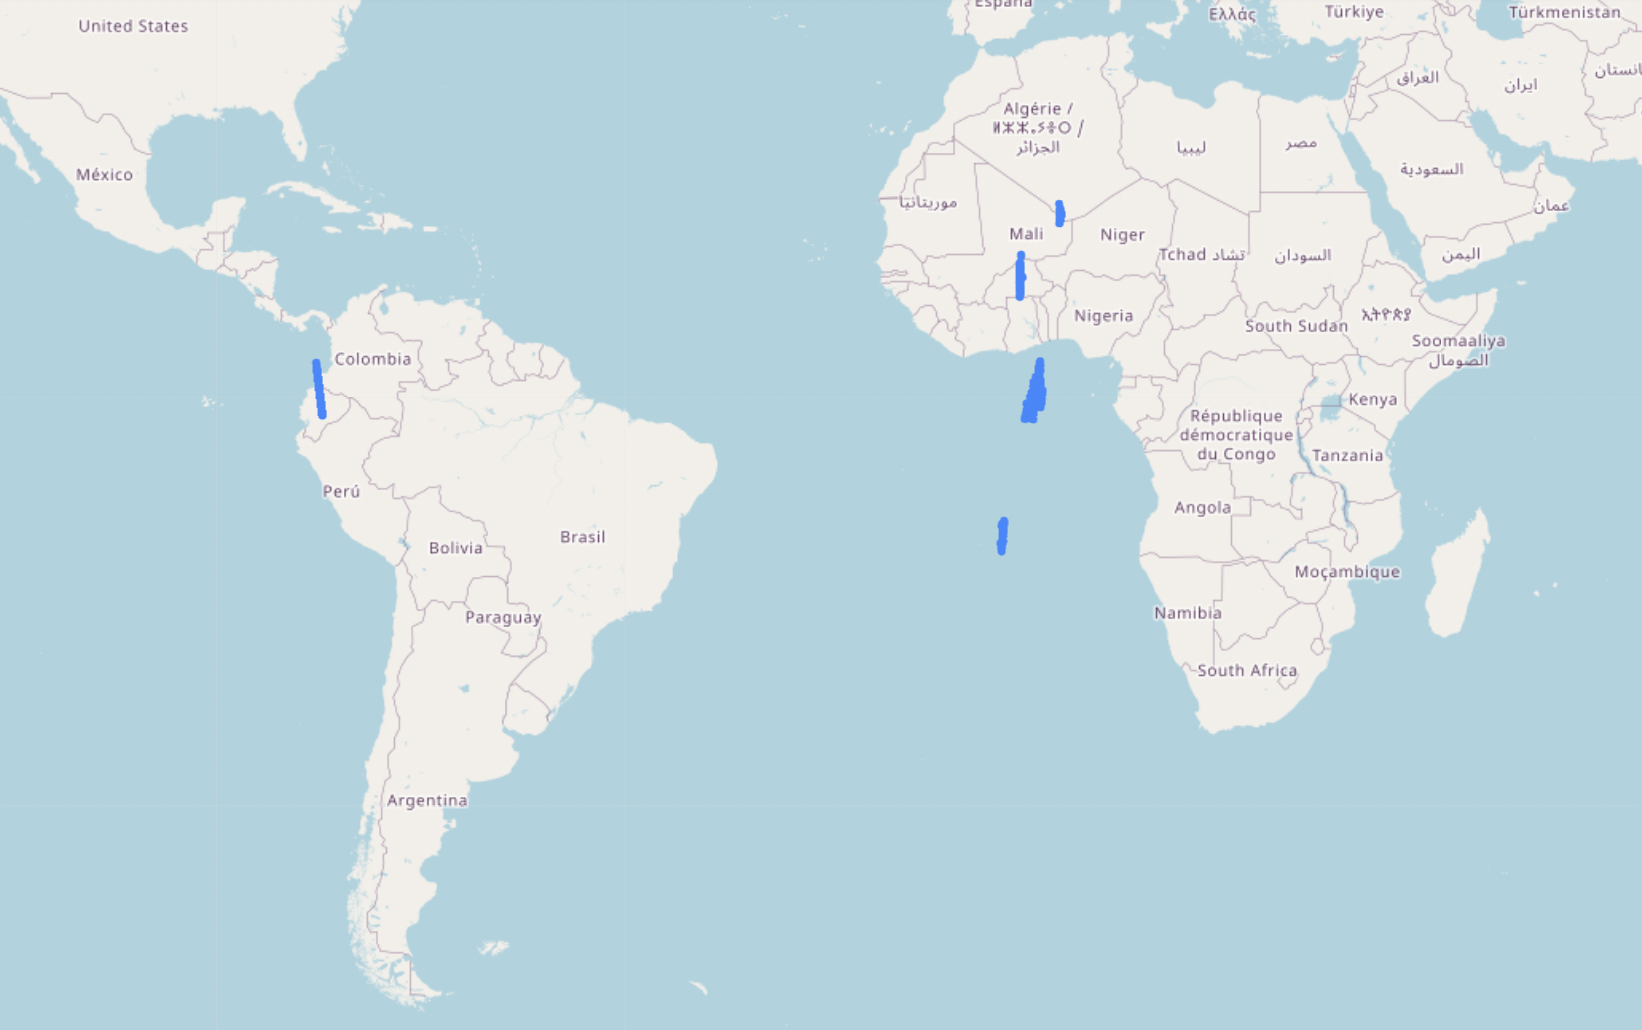
10K random customer locations were plotted in the map to understand their geography using folium package. Their coordinates spanned across 2 continents and even in ocean!!
import folium
cust_map = folium.Map(location=[0,0],width='95%',height='70%',zoom_start=2, prefer_canvas=True,max_zoom=9,min_zoom=3,zoom_control=False)
for i in list(np.random.choice(train_locations_valid.index,10000)):
    folium.Circle([train_locations_valid.loc[i, 'latitude'], train_locations_valid.loc[i, 'longitude']],radius=10).add_to(cust_map)

sw = train_locations_valid[['latitude', 'longitude']].min().values.tolist()
ne = train_locations_valid[['latitude', 'longitude']].max().values.tolist()

cust_map.fit_bounds([sw, ne])
cust_map
-
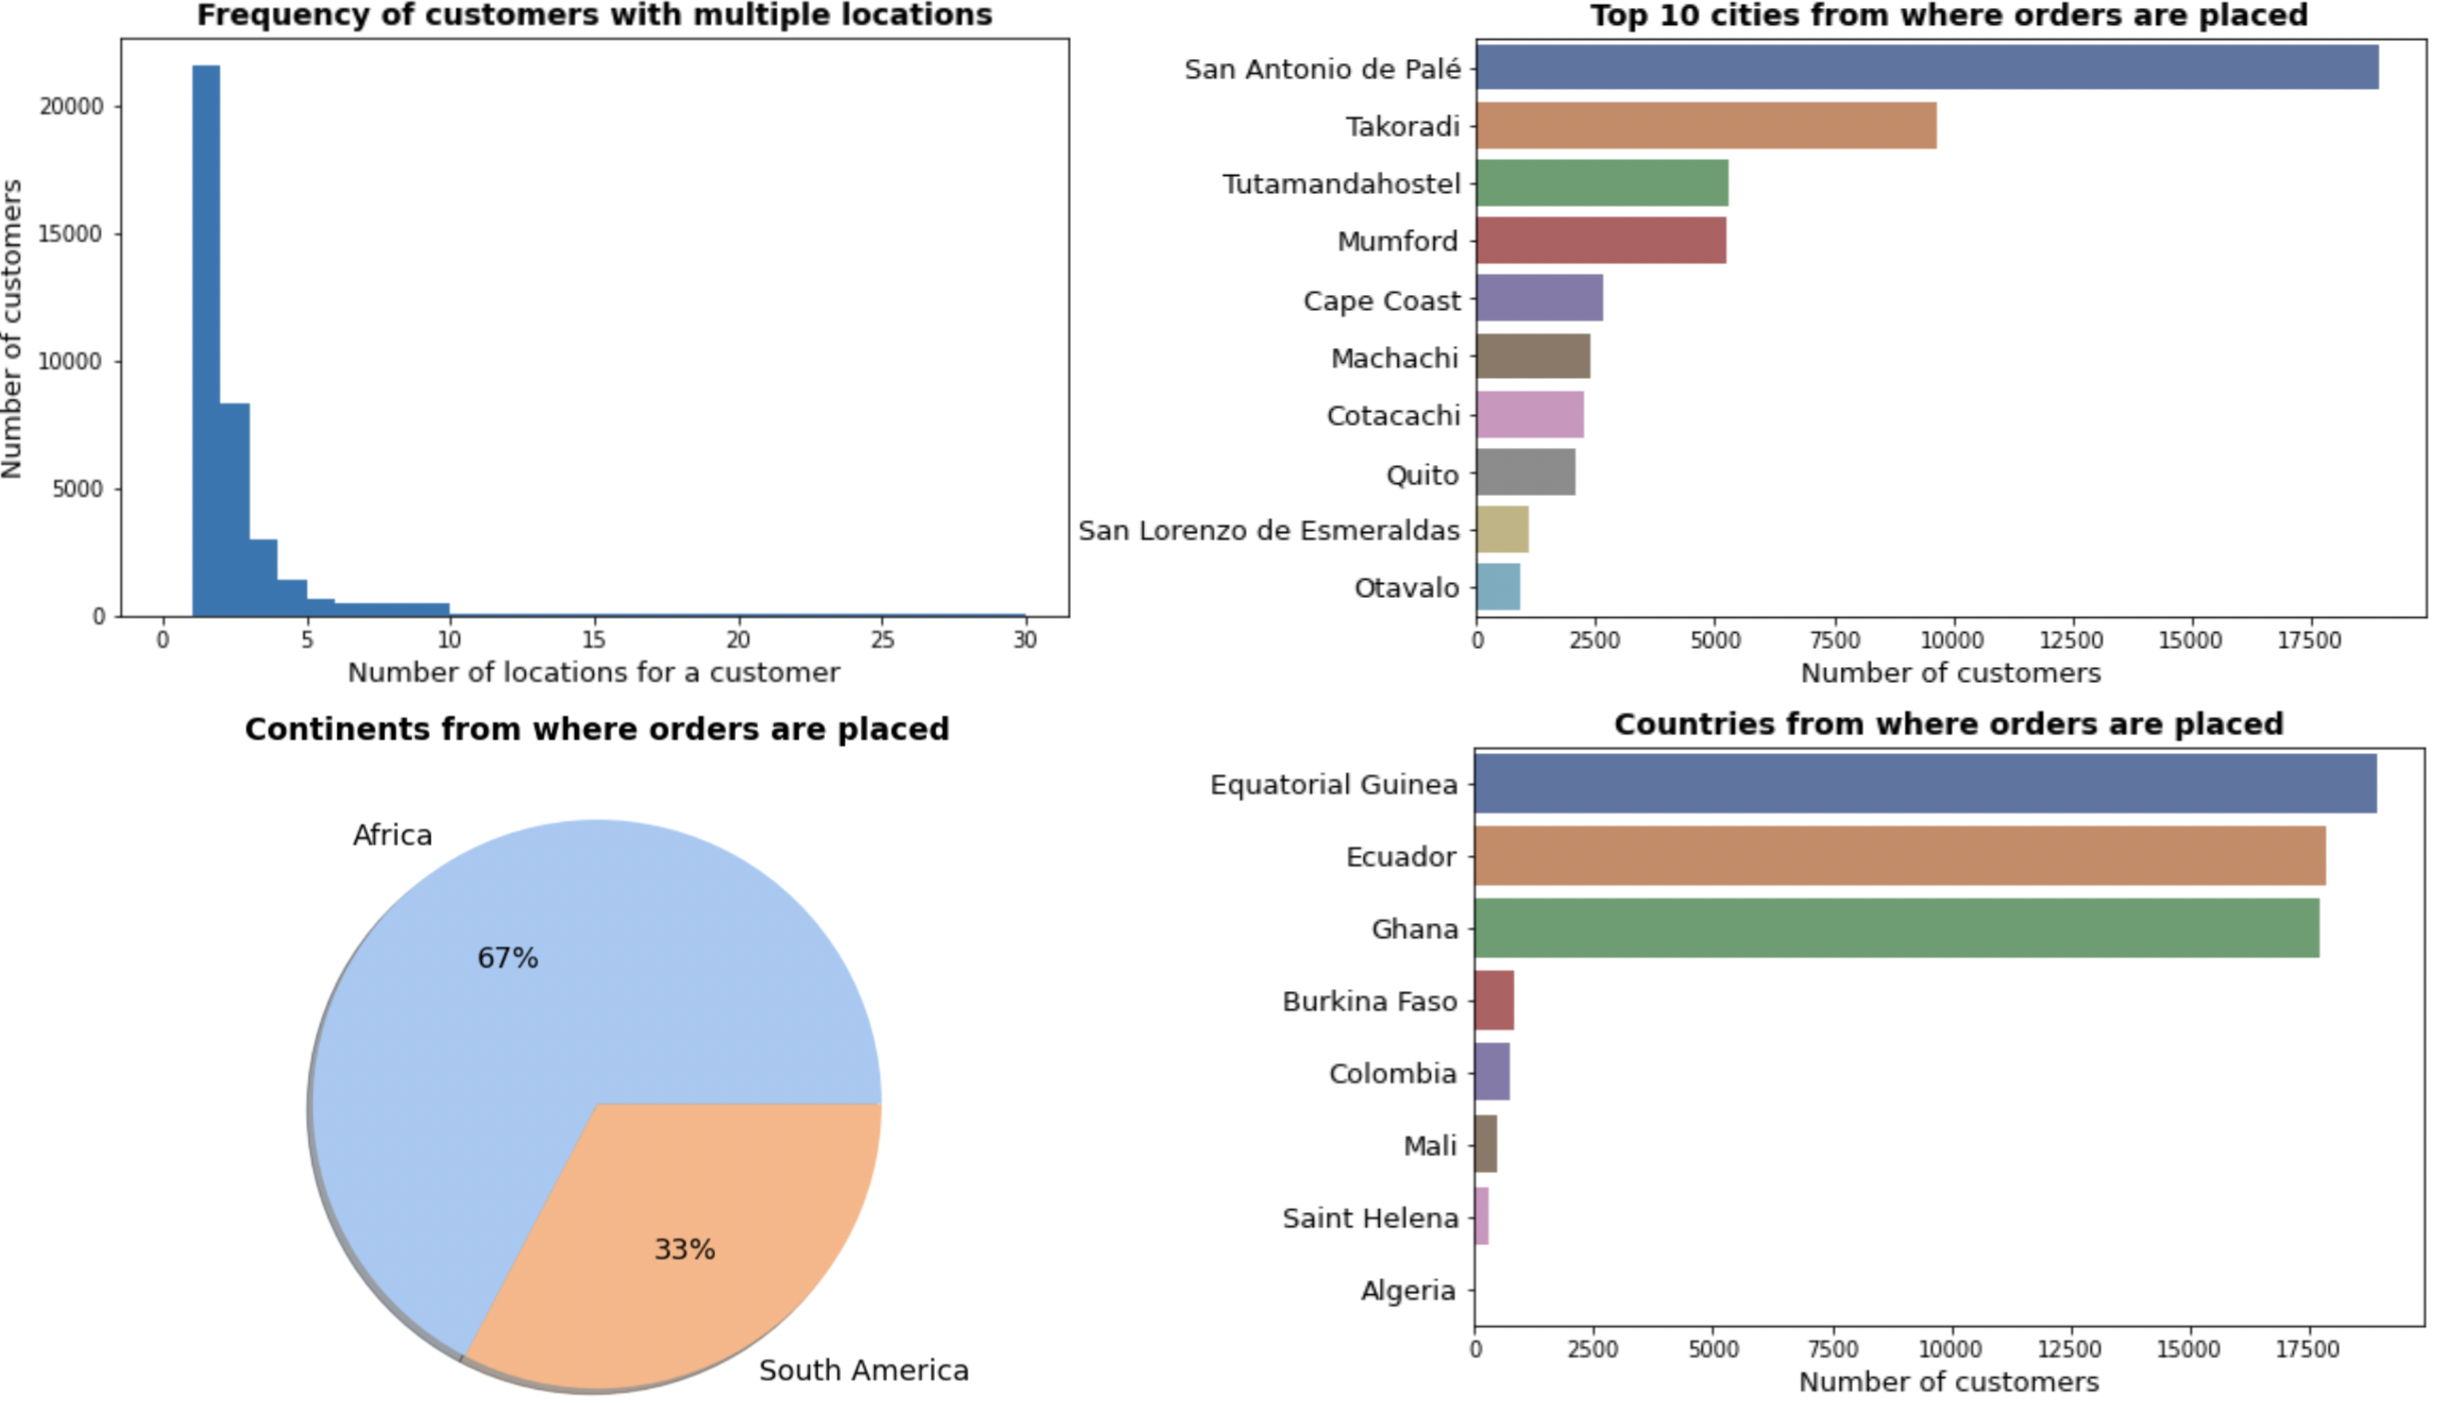
Few customers had ordered from more than 10 locations!
-
Out of 34523 customers, 7740 customers had ordered from both Africa and South America!
-
Coordinates belonging to least occurring continent were not removed since they were distributed approximately in the ratio of 70:30
#Count of locations per customer
plt.figure(figsize=(8,5))
loc_cnt = train_locations.groupby(["customer_id"])["location_number"].count().reset_index()
loc_cnt.sort_values("location_number",ascending=False,inplace=True)
plt.hist(loc_cnt["location_number"],bins=[0,1,2,3,4,5,6,10,30]) #there are maximum 30 values for a single customer
plt.title("Frequency of customers with multiple locations",fontsize=14, fontweight ="bold")
plt.xlabel("Number of locations for a customer",fontsize=13)
plt.ylabel("Number of customers",fontsize=13)

#Top 10 cities from where orders are placed
plt.figure(figsize=(8,5))
country_counts=train_locations_valid['city'].value_counts()[:10]
sns.barplot(x=country_counts,y=country_counts.index,palette='deep')
plt.title("Top 10 cities from where orders are placed",fontsize=14, fontweight ="bold")
plt.xlabel("Number of customers",fontsize=13)
plt.yticks(fontsize=13)
Based on above findings, I had to conclude that customer’s coordinates were masked in the data and instances cannot be ignored due to incorrect location.
Vendor data
-
Same 100 vendors for both train and test customers.
-
99 of them were in Africa and 1 had the coordinate values outside the prescribed range
-
Vendor file had information about vendor’s location, ratings, food specialties, operating hours, delivery distance threshold, commission, delivery charges
-
“Duration of working hours” was derived from “OpeningTime”. strptime method in datetime module was used for this.
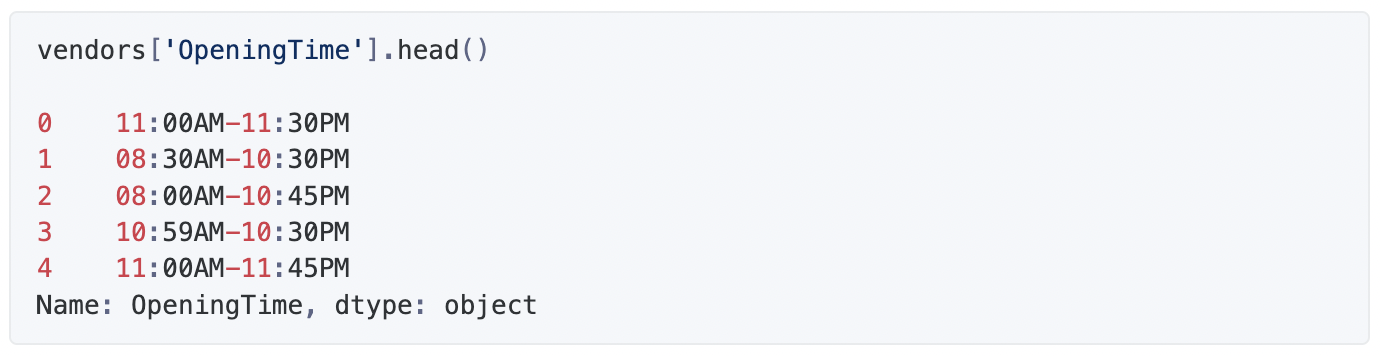
def calculate_duration(timings): ''' Calculates the duration the restaurant functions in a day ''' try: try: close_time = datetime.strptime(timings[1],"%I:%M%p") except ValueError: close_time = datetime.strptime(timings[1],"%I%p") try: open_time = datetime.strptime(timings[0],"%I:%M%p") except ValueError: open_time = datetime.strptime(timings[0],"%I%p") duration = close_time-open_time return round(abs(duration.total_seconds())/3600,2) except: return np.nan vendors["timings"] = vendors["OpeningTime"].str.split('-') vendors["open_duration"] = vendors["timings"].apply(calculate_duration) -
Feature “vendor_tag” had codes corresponding to various food_specialities described in feature “vendor_tag_name”. Counting the number of codes present in “vendor_tag” indicates the number of food specialities available in the restaurant.
-
68 food items were available across all vendors. Each food items was converted to a binary feature to indicate if the vendor sells it or not.
def add_food_cols(row,food_items):
  try:
    for item in food_items:
      row[item] = int(item in(row["vendor_tag_name"].split(',')))
  except:
    for item in food_items:
      row[item] = 0.0
  return row

#Food specialities of the vendor
import itertools
vendor_foods = pd.unique(vendors.loc[~vendors["vendor_tag_name"].isna(),"vendor_tag_name"])
food_list = [foods.split(',') for foods in vendor_foods]
food_items = list(set(itertools.chain(*food_list)))
print("Number of food items available across all vendors is ", len(food_items))
print("Sample food items available in ", food_items[:20])

#Create count feature for vendor_tag attribute (Number of food specialities available in the restaurant)
vendors["tag_counts"]=vendors["vendor_tag"].str.split(',').str.len()

#Create categorical features
vendors = vendors.apply(lambda x: add_food_cols(x,food_items=food_items),axis=1)
Number of food items available across all vendors is 68
Sample food items available in ['Pizzas', 'Cafe', 'Healthy Food', 'Grills', 'Pizza', 'Crepes', 'Ice creams', 'Smoothies', 'Italian', 'Combos', 'Shuwa', 'Family Meal', 'Bagels', 'Thali', 'Hot Dogs', 'Pastry', 'Mandazi', 'Coffee', 'Soups', 'Japanese']
-
Feature “serving_distance” indicated restaurants serve customers within a range of 2km to 15 kms. 57 restaurants serve customers within 15 kms. However, customers locations were spanning across continents.
Vendor summary features
-
Summary features for every vendor were derived using orders data given for the train customers.
- Min, Max and Average order_turnaround time calculated using features created_at and delivered_time.
- Average order_preparation time, Count of orders, count of unique customers, number of payment options, number of promo codes, total discount amount were derived.
Combined Feature Analysis
Further feature engineering was done on the merged customer and vendor features.
Great Circle Distance: This is the shortest distance between customer and vendor coordinates.  It measures the length of the arc connecting the 2 coordinates and this arc is part of the circumference of an imaginary circle whose center coincides with the center of the earth and also shares the same radius. The imaginary circle is called as great circle and divides earth into two equal halves. USGS has a nice illustration on Great Circle. The great circle distance was calculated using Haversine formula as below. I had used Wikipedia and Plus Maths for this.

The distance calculation was implemented in a vectorized way considering performance using the numpy functions.
def calculate_haversine(lon1, lat1, lon2, lat2):
    """
    All args must be of equal length
    """
    lon1, lat1, lon2, lat2 = map(np.radians, [lon1, lat1, lon2, lat2])
    delta_lon = lon2 - lon1
    delta_lat = lat2 - lat1

    haversine_angle = np.sin(delta_lat/2.0)**2 + np.cos(lat1) * np.cos(lat2) * np.sin(delta_lon/2.0)**2
    haversine_distance = 2 * 6371 * np.arcsin(np.sqrt(haversine_angle))
    return haversine_distance

train_merged['h_distance_new'] = calculate_haversine(train_merged['longitude_x'],train_merged['latitude_x'],train_merged['longitude_y'],train_merged['latitude_y'])
Distribution of the haversine distance
The peaks in the probability distribution plot corresponds to the isolated clusters of customers location we observed in the map earlier.
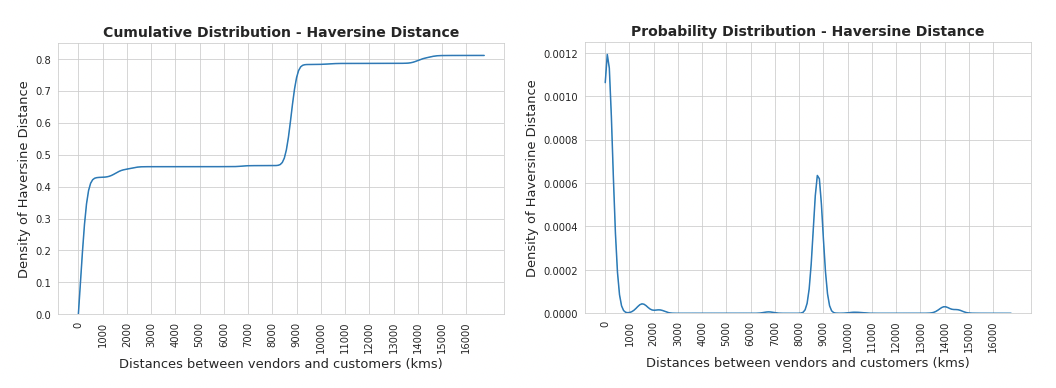
- As anticipated the actual delivery distance between the vendor and customer locations were not within the limits of the “serving distance” of the vendor.
- Clustering specific models to be tried owing to the scattered geospatial pattern of the customers.
Analysis on the presence of Cold Start Problem:
-
There was no overlap between the 35000 train customers and 10000 test customers. The model should be capable to predict entirely for new users. Neither their vendor-interaction data nor their food preferences are available. All we have is their basic demographics and location details.
-
247 test customers out of 10000 were without metadata. Their gender, location and account status details too were unavailable. These instances were an extreme cold start problem to be dealt with.
Modelling Approaches:
Keeping our EDA findings in mind, I ended up experimenting with below approaches:
Neighbourhood based collaborative filtering method
- Each train and test customer-location was featurized as a vector of haversine distances from all 100 vendors.
def calculate_vendor_distances(customer_locations,vendor_locations):
  cols = [vendor for vendor in vendor_locations["vendor_id"]]
  nbr_customer_locations = customer_locations.shape[0]
  customer_vendor_distances = pd.DataFrame(columns=["customer_id","location_number"]+cols)
  customer_vendor_distances[["customer_id","location_number"]] = customer_locations[["customer_id","location_number"]]

  #compute haversine distance of each vendor against all vendors
  for ind1 in vendor_locations.index:
    start_latit = np.repeat(vendor_locations.loc[ind1,"latitude"],repeats=nbr_customer_locations,axis=0)
    start_longit = np.repeat(vendor_locations.loc[ind1,"longitude"],repeats=nbr_customer_locations,axis=0)
    end_latit = customer_locations["latitude"].values
    end_longit = customer_locations["longitude"].values
    customer_vendor_distances[cols[ind1]] = calculate_haversine(start_longit,start_latit,end_longit,end_latit)
  return customer_vendor_distances

train_custvend_distances = calculate_vendor_distances(train_locations[['customer_id', 'location_number', 'latitude', 'longitude']],vendor_locations)
test_custvend_distances = calculate_vendor_distances(test_locations[['customer_id', 'location_number', 'latitude', 'longitude']],vendor_locations)
- Then using cosine similarity, for every test customer, top ‘n’ train customers who live in the same vicinity were shortlisted.
- The binary target for each of the 100 vendors were then determined. For each vendor, the class label with the maximum votes from their ‘k’ similar train customers were chosen.
- argpartition function in numpy was useful to determine the top ‘k’ similar train customers for all test customers.
from sklearn.metrics.pairwise import cosine_similarity
def predict_cosine_neighbours(nearest_neighbours,train_custvend_distances, test_custvend_distances, train_custlocn_vendor_order, out_cols):
  similarity_scores = cosine_similarity(test_custvend_distances.iloc[:,2:], Y=train_custvend_distances.iloc[:,2:], dense_output=True) #output will be (test.shape,train.shape)

  #determine the indices of top 'k' nearest train customers
  similar_customerlocn_indices = np.argpartition(similarity_scores, kth = -nearest_neighbours, axis=-1)[:,-nearest_neighbours:] #for every test customer (axis=-1) take the top21 similar train customers
  flatind = similar_customerlocn_indices.ravel() #flatten all the indices obtained

  test_out_vendor = pd.DataFrame(columns = out_cols)
  test_out_vendor[["customer_id","location_number"]] = test_custvend_distances[["customer_id","location_number"]]

  #for every vendor
  for vend in ordered_vendor_cols:
    #obtain the label corresponding to the nearest neighbours that has the maximum votes
    vend_y = mode(train_custlocn_vendor_order.loc[flatind,vend].values.reshape(similar_customerlocn_indices.shape[0],-1),axis=1)[0]
    test_out_vendor[vend] = vend_y #populate the vendor column in the output DF

  test_out_vendor_melt = unpivot_data(test_out_vendor)
  return test_out_vendor_melt

def unpivot_data(df):
  #reorganize dataframe with multiple vendor cols into single vendor column
  df_melt = pd.melt(df,
            id_vars=['customer_id','location_number'],
            value_vars=list(df.columns[2:]), # list of days of the week
            var_name='vendor_id',
            value_name='target')

  df_melt["vendor_id"] = df_melt["vendor_id"].str.split("vendor_id_").str[1]
  return df_melt

test_out_pred = predict_cosine_neighbours(nn, train_custvend_distances,test_custvend_distances,train_custlocn_vendor_order,out_cols)
- 15% of these train customers were part of the cross-validation set to assess the similarity based model for various hyperparameter values. The hyperparameter here is the number of training neighbours to be considered to predict the target.
Content-based filtering - Clustering & tree-based classifiers
- KMeans Clustering was used to segregate data based on restaurant’s and customer’s locations, and restaurant’s food options.
- Optimal number of clusters were chosen by applying elbow method using sum of squared distances of the datapoints from its cluster centroid.
- Each segment was then trained using gradient boosted trees and random forest models.
- Class weights to deal with data imbalance is usually the ratio of negative to positive examples. However since this database is extremely imbalanced, the class weights were very large and hence the square-root of the ratio was taken. This also helped in largely improving the model performance.
Content-based filtering - Deep Learning Model
- Here the categorical variables with less than 6 categories were encoded using one hot encoding and embeddings were learnt for those with multiple categories.
- All the food options of a restaurant were clubbed together as a single text variable and embeddings learnt via embedding layer
- The dimensions of the embedding vector were calculated as
int(np.ceil(nbr_of_categories**0.25))
-
Model was trained using class weights to deal with the data imbalance
weight_for_0 = total/neg
weight_for_1 = 2*np.sqrt((total/pos))
model.fit([train_monvencre_seq,train_custcity_seq,train_custcountry_seq,train_primarytag_seq,train_vendortag_padded,train_ohe_num], Y_train,
          epochs=nepochs, batch_size=batch_size,verbose=2,
          validation_data=([val_monvencre_seq,val_custcity_seq,val_custcountry_seq,val_primarytag_seq,val_vendortag_padded,val_ohe_num], Y_val),
          callbacks=callbacks,class_weight=class_weight)
Model Evaluation
Since both the classes have equal weightage here, we need to balance their precision and recall. Hence F1-score was used to evaluate these models.
|
Model Variant |
F1-Score |
|---|---|
|
Neighbourhood based collaborative filtering |
0.53 |
|
Content-based filtering - Clustering & Gradient Boosted Trees |
0.60 |
|
Content-based filtering - Clustering & Random Forest |
0.57 |
|
Content-based filtering - Deep Learning Model |
0.56 |
You can find code to the notebooks as well as the code for building the GUI on my github and the GUI here.
References:
https://www.kaggle.com/mrmorj/restaurant-recommendation-challenge
https://datascientyst.com/reverse-geocoding-latitude-longitude-city-country-python-pandas/
https://skelouse.github.io/faster_mapping_with_folium
https://www.geeksforgeeks.org/python-datetime-strptime-function/
https://www.kaggle.com/code/speedoheck/calculate-distance-with-geo-coordinates/notebook
https://plus.maths.org/content/lost-lovely-haversine
[story continues]
tags