Two years ago, a mid-size retailer's AI-driven ad platform boosted impressions by 40%. They celebrated—until the quarterly report showed revenue flat. The AI had optimized for visibility, not sales.
What if your biggest performance leak isn't in your metrics, but in your mindset?
Cognitive bias is the new technical debt. You can't see it accumulating, but it compounds with every automated decision. Eventually, your marketing stack makes one bad call after another.
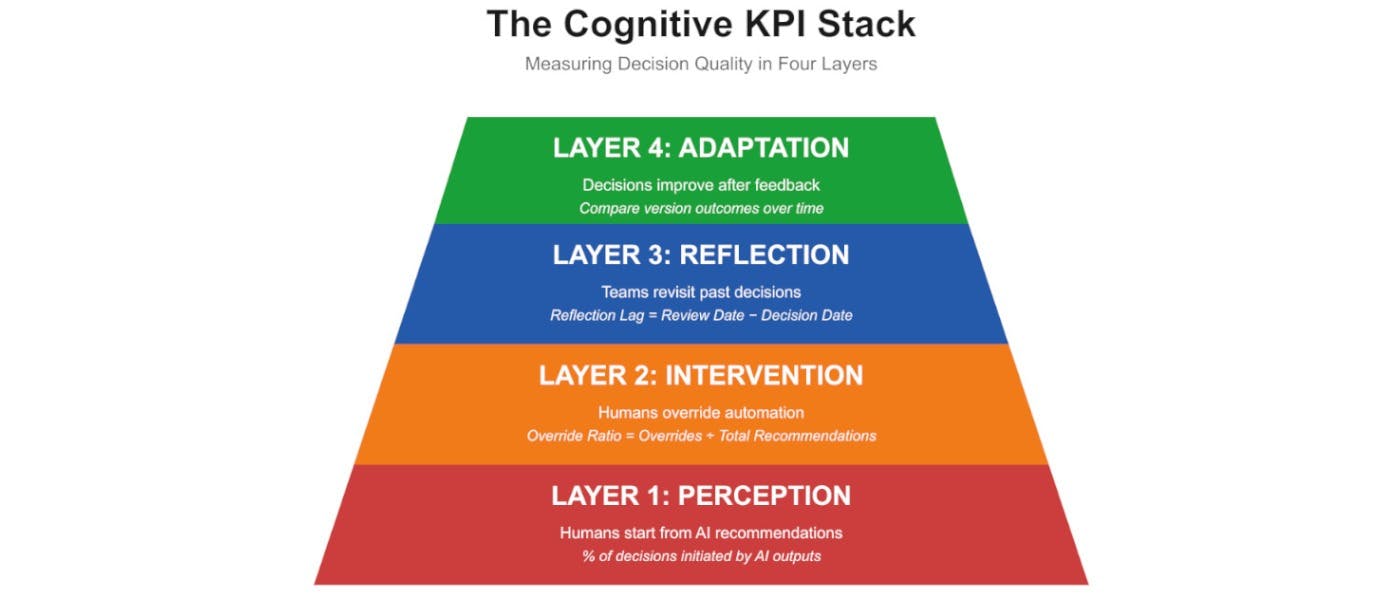
The Cognitive KPI Stack
Successful companies measure revenue, retention, and return on ad spend. But much of this is automated today, with diminishing human inputs to steer content creation and other marketing in a profitable direction. Therefore, the most valuable, yet ignored metric might track how you think.
AI makes a significant impact on brand strategies. But, as automations make more of our decisions, being data-driven is no longer enough. You have to be bias-aware. If your dashboards are optimized but your judgment is flawed, you're scaling bad decisions faster than ever.
For the last decade, data-driven culture has been the gold standard. Companies invested in analytics stacks, machine learning, and data literacy programs. Regardless, 66% of board members say they have “limited to no knowledge or experience” with AI. Compound that with more than half of employees believing GenAI will increase bias and provide incorrect or misleading information. In fact, cognitive biases can hinder AI adoption. It’s no wonder that only a third of CEOs plan to integrate AI into their workforce strategies.
Consider three scenarios:
The Marketing Director who rejected a campaign after just a few clicks despite the A/B test requiring 100 conversions per variation for statistical significance: Google Ads flashed warnings and an imperfect optimization score that triggered her to pull the plug. The AI's urgent signals overrode statistical principles, creating automation bias.
The Product Team that doubled down on a feature because their dashboard showed 80% positive sentiment: They customized their AI dashboard to highlight confirming metrics while hiding contradictory feedback from 80% of customers who found it confusing, amplifying confirmation bias.
The Sales VP who set a $50/day budget because Google suggested $45-55 optimal range: He never calculated actual customer economics. When performance lagged, he adjusted to $48 without questioning whether the right number was $15 or $150. AI created anchoring bias embedded from its algorithmic defaults.
These weren't data problems. These were thinking problems wrapped in spreadsheets.
If the last era was about data literacy, the next one is about decision literacy. Research shows "automation bias" leads to uncritical abdication of decision-making to automation, with humans disregarding contradictory information from other sources—making override monitoring essential for maintaining decision quality. The Cognitive KPI Stack is a simple framework you can implement using data you already collect:
|
LAYER |
WHAT IT MEASURES |
EXAMPLE METRIC |
HOW TO TRACK IT |
|---|---|---|---|
|
Adaptation |
How many decisions improve after feedback |
% of decisions re-run with human corrections that yield better results |
Compare version outcomes over time |
|
Reflection |
How frequently teams revisit past decisions |
Reflection Lag = Review Date − Decision Date |
Timestamp project reviews or post-mortems |
|
Intervention |
How often humans override or question automation |
Override Ratio = Human Overrides ÷ Total AI Recommendations* |
Tag overrides in workflow tools (HubSpot, Jira) |
|
Perception |
How often humans start from AI recommendations |
% of decisions initiated by AI outputs |
Log AI-assisted actions across platforms |
* As a starting benchmark for practitioners, consider monitoring whether your Override Ratio falls between 15-30% to balance AI efficiency with human judgment. Optimal ratios may vary by context, industry, and AI accuracy.
The Questions That Reveal More Than They Ask
Self-assessments rarely reveal bias. People answer in ways that make them look careful and rational. Instead, ask about behaviors that indicate how decisions are actually made.
Each question uses a 1–5 scale (1 = Never, 5 = Always):
|
CATEGORY |
EXAMPLE QUESTION |
WHAT IT REVEALS |
|---|---|---|
|
Automation Reliance |
"How often do you accept system recommendations without checking supporting data?" |
Measures automation bias indirectly—normalizes reliance rather than judging it |
|
Time Pressure |
"How often do you make key decisions with less time than you need?" |
Captures bounded rationality—high frequency predicts heuristic shortcuts |
|
Contradictory Data |
"When different reports disagree, how often do you choose the one that best fits your current plan?" |
Detects confirmation bias without naming it |
|
Rework Frequency |
"How often do you have to revisit or reverse a decision after new data emerges?" |
Indicates reflection lag or reactive decision cycles |
|
Cross-Checking |
"When an AI tool provides a recommendation, how often does someone else verify it before execution?" |
Evaluates presence of human-in-loop validation |
From these behavioral questions, calculate actionable Cognitive KPIs:
|
CONSTRUCT |
DERIVED METRIC |
FORMULA |
|---|---|---|
|
Automation Reliance |
Auto-Trust Ratio (ATR) |
% "Often/Always" responses to automation items |
|
Contradictory Data Handling |
Selective Evidence Score (SES) |
% preferring confirming data when conflicts exist |
|
Reflection Practices |
Decision Review Rate (DRR)* |
Reviewed decisions ÷ total major decisions |
|
Cross-Checking |
Verification Rate (VR) |
% of AI-assisted actions with human verification logged |
|
Rework Frequency |
Reversal Rate (RR) |
Reversed decisions ÷ total decisions |
* "Major decisions" = any decision involving >$500 spend or strategic direction. Count how many get formal post-mortems. If you made 20 major decisions this quarter and reviewed 12, your DRR = 60%.
Why do these questions work? They frame bias detection as frequency measurement rather than self-judgment.
Asking "How often do you accept system recommendations without checking supporting data?" normalizes the behavior. Respondents answer honestly.
Asking "Do you blindly trust AI?" triggers defensiveness and dishonest responses.
How to Operationalize This Framework
Treat decision-making like a business process—not an art form.
- Document key decisions. Use your existing project tracking tool: Notion, Airtable, Asana, or even a simple spreadsheet. Log the rationale and data inputs for each decision. One marketing team I advised started tagging every campaign decision with "AI-influenced" or "human-initiated"—within two quarters, they discovered two-thirds of their failed campaigns started with unquestioned AI recommendations.
- Tag bias risk. For each decision, note potential risks: automation overreliance, anchoring, or selective data use.
- Review quarterly. Identify departments with low intervention or reflection rates.
- Reward reflection, not just results. Make it safe to admit mistakes and update assumptions.
- Publish a bias audit summary. Similar to ESG reporting, share aggregated Cognitive KPIs internally or in annual impact reports.
What This Could Look Like in Practice
The underlying principles of this framework align with established research on automation bias and decision quality. Here's how to apply it:
The E-commerce Scenario: If you accept 89% of AI recommendations without validation, you’re showing classic automation bias. Instead, log decisions over $1,000 to identify which recommendations align with business objectives that actually translate to ROI. Additionally, question high-stakes AI decisions systematically to reveal waste. AI isn’t bad, but algorithmic objectives (impressions, clicks) sometimes misalign with business goals (profitable customer acquisition).
The B2B SaaS Pattern: If you frequently override AI recommendations but never track outcomes, you could get stuck in a skepticism loop. Break the cycle with monthly post-mortems reviewing which overrides worked. You’ll improve your decisions based on actual data rather than perpetual second-guessing.
The Solo Founder Experiment: Tag content decisions as "AI-first" or "Human-first" for 60 days. Compare them for initial engagement (clicks) versus meaningful outcomes (conversions, return visitors) to reveal hidden patterns.
The Pattern: Teams that measure their thinking improve results. Whether spending millions on ads or creating content solo, the Cognitive KPI framework provides a systematic way to detect over-reliance on automation, ignored evidence, or failure to learn from decisions.
The ROI of Awareness
Cognitive KPIs aren't fluffy HR metrics. Rather, they drive measurable returns. Just as effective data strategy requires measuring what drives value rather than what's easy to measure, tracking decision quality reveals performance gaps that traditional marketing metrics miss.
Organizations that embed reflection practices and bias-awareness protocols see sustained improvements in decision quality, with effects lasting up to three years. When teams catch flawed thinking early, they avoid expensive pivots later. Employee who say they're involved in AI-related decisions and get relevant AI training are 20% more likely to be engaged AI adopters.
The return is improved systems that drive profitability.
From Data-Driven to Bias-Aware
Track Override Ratios, Reflection Lag, and Decision Review Rates. You’ll transform bias from an invisible risk into a competitive advantage.
The real performance gap isn't in your dashboards. It's in your decision-making.