Table of Links
- ABSTRACT
- INTRODUCTION
- PROPOSED EPIDEMIC CYBER-PHYSICAL SYSTEM MODEL
- PROPOSED INSURANCE PREMIUM PRINCIPLE
- SIMULATION RESULTS
- CONCLUDING REMARKS AND REFERENCES
SIMULATION RESULTS
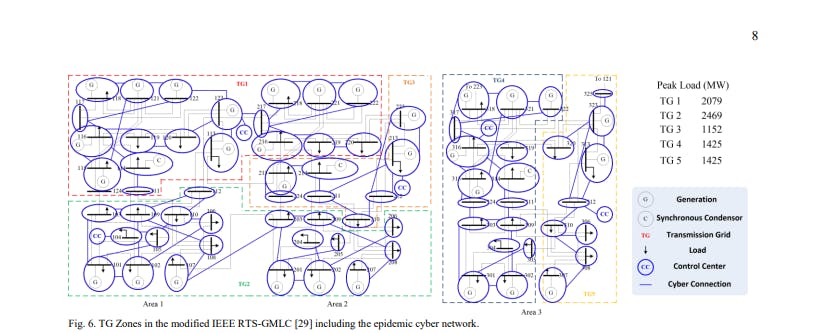
Case studies are performed to validate the proposed reliability assessment framework and cyber insurance model. As shown in Fig. 6, a benchmark IEEE RTS-GMLC is deployed [29]. The IEEE RTS-GMLC incorporates the increasing share of renewable energy resources such as wind and solar energies. To study the effectiveness of mutual insurance, the 3-area test system are divided into 5 TGs. The IEEE RTS-GMLC is further augmented by incorporating the epidemic cyberattack model. The cyberattack parameters of the epidemic network are assigned as follows: 𝑍𝑒𝑝𝑖 = 2000 hrs, 𝑅𝑒𝑝𝑖 = 4 hrs, 𝜀 = 2, and 𝑐 = 0.8. A preliminary comparison is made on the system risk in the test system under various scenarios. Risk indices estimating load curtailment and fault coverage are adopted from [30]. Denote 𝐿𝐶 as the load curtailment and 𝐹𝐶 as the count of faulty buses at the m-th time step.
The Expected 𝐿𝐶 and 𝐹𝐶 are defined as follows: 𝐸𝐿𝐶 = 1 𝑁𝑚 ∑ 𝐿𝐶𝑚 𝑁𝑚 𝑇 𝑚=1 (10) 𝐸𝐹𝐶 = 1 𝑁𝑚 ∑ 𝐹𝐶𝑚 𝑁𝑚 𝑇 𝑚=1 (11) Parameters of the cyber-physical elements installed in the substations are listed in Table II. When the substation’s smart monitoring is functional, the server is connected to other elements. Otherwise, the server is disconnected from other elements. Six scenarios are studied to demonstrate the effectiveness of the job assignment and smart monitoring. As shown in Table III, the deployment of job assignment and smart monitoring technologies effectively reduces the ELC and EFC. Reduced ELC and EFC indicate enhanced security and reliability of power supply. The job assignment facilitates Scenario 2 with 20% improvement from Scenario 1 in both ELC and EFC. With the smart monitoring technology enforced, Scenario 4 improves 7% on ELC and EFC over Scenario 1. In Scenarios 5 and 6, smart monitoring plus the job assignment can further improve several percent from Scenarios 2 and 3 with job assignment alone.
The reliability-based OPF is carried out in MCS based on the state sampling method. The sampled period is 40 years with hourly time steps. The server smart technology deployment within the substations determines the SCT. Cyberattacks that penetrate the substation servers may disturb the grid operation by sending spurious commands to disconnect generation from the grid, causing physical load losses. The load loss statistics is then converted into the monetary reliability worth to estimate the cybersecurity insurance premiums. To highlight the merits of the proposed Shapley premium design, two case groups are created to compare job thread assignment, smart monitoring, and correlation coefficients at varying degrees. Case Group 1: Based on Scenario 1 (𝐽1 , 𝜇𝑏, 𝜆𝑏) where in the substation only a single job thread is available without smart monitoring. Case Group 2: Based on Scenario 6 (𝐽3 , 𝜇𝑐 , 𝜆𝑐)where the strongest job assignment and substation smart monitoring are enforced. To explore the loss characteristics in Case Group 1, Table IV summarizes the expected values, Standard Deviations, and Coefficients of Variation under various strengths of correlation 𝑟. CoV is obtained from the SD being divided by the expected value. The expected values come close to SDs, resulting in CoVs only fluctuating in a small range of [0.74 1.13].
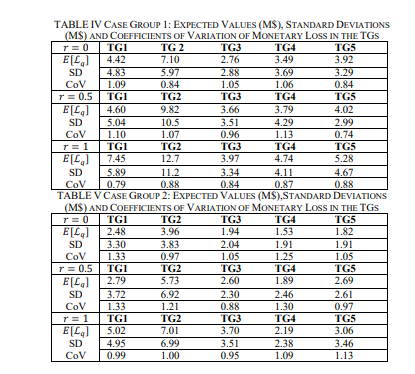
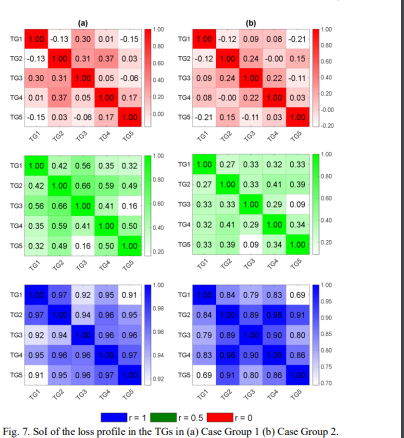
Since a stronger correlation 𝑟 signifies the infectiousness of the epidemic model and tends to bring higher expected losses, the common cyber risk across TGs also increases. In Case Group 2, the incentive of investing on cyber-physical enhancement can be observed from Table V that expected losses are reduced substantially and reduction of SDs occurs to a lesser extent, with CoVs lying in [0.88 1.33]. In Fig. 7, the sampled SoI among the TGs are demonstrated in the Pearson correlation matrix.
The correlation is symmetric and correlation between each of the two TGs can be observed in the off-diagonal entries. Fig. 8(a) depicts the correlation matrix of the Case Group 1. When 𝑟 = 0, the SoI across the TGs are close to 0 with higher correlations between the neighboring TGs in the same areas. The correlations range around 0.45 as 𝑟 increases to 0.5. When 𝑟 = 1, the correlations across all TGs are above 0.9. The correlation matrix in Case Group 2 is as shown in Fig. 8(b). Due to reduced load losses, the correlations are in general weakened between the same pair of TGs in Case Group 1. Insurance premiums are designed to prepare TGs for catastrophic losses induced by probable cyberattack events. For interconnected TGs, mutual insurance accounting for respective marginal loss statistics would be a sensible option.
The premium with a high-risk loading offers solid indemnity, which may however be less financially appealing to potential participants. An ideal premium design should be meticulously formulated to avoid excessive financial burdens while providing sufficient loss indemnities for the insured parties. The highly infectious nature of the cyber epidemic model dictates a heavily skewed tail risk. To validate the design of the proposed cyber-insurance principle, herein (a) TCE premium 𝜋1 , (b) Coalitional premium 𝜋2 , and (c) Shapley premium 𝜋3 of this study are compared at various degrees of correlation of the TGs. The TCE Premium is the most conservative design predominantly responsive to the tail risk, providing great redundancy at the cost of high-risk loading. On the contrary, the Coalitional Premium is the most affordable package by excluding extreme high-loss events with low probabilities. The Shapley Premium is cooperative and tailored to add further coverage against the tail risk, striking a balance between the affordability and loss coverage.
To gauge the relative premium burden against the expected risk, RLC is defined as follows: 𝜌(ℒ𝑞) = 𝜋(ℒ𝑞)/𝐸[ℒ𝑞]− 1 (12) where 𝜌(ℒ𝑞) should be generally positive to gather sufficiency budget for loss coverage. While positive RLC is preferable against the unexpected extreme risk, excessively high RLC would discourage the TGs from insurance participation. In [17], the indemnities of 𝜋1(ℒ𝑞) are not clearly specified since the original design is tailored to a third-party insurer. In this paper, all premium designs are assumed to be mutual insurance. All participating entities are both insurers and insureds. For the sake of brevity, the indemnities of 𝜋1(ℒ𝑞) are proportionally allocated based on 𝛤𝑞 𝜓 (𝜋2): 𝛤𝑞 𝜓 (𝜋1 ) = ∑𝑞 𝜋1(ℒ𝑞) ∗ 𝛤𝑞 𝜓(𝜋2) ∑ 𝛤𝑞 𝜓 𝑞 (𝜋2) (13) In Tables VI and VII, 𝜋1 , 𝜋2 , and 𝜋3 are evaluated based on the loss statistics extracted from the two case groups with heavy tail risks. Characteristics of each design will be further elaborated numerically as follows. The premiums of Case Group 1 are shown in Table VI. In each TG, 𝜋1 , 𝜋2 , and 𝜋3 are positively correlated with the strength of correlation 𝑟. 𝜋1 has the most conservative payment schedule and can be financially burdensome. 𝜋1 may penalize the participants with heavy risk loading when extreme catastrophic events do not happen. Cost-effectiveness of 𝜋1 is unacceptably low because the maximum of 𝜌1 exceeds 3. On the flip side, 𝜋2 is an entry-level premium design devised to be the most affordable and evenly distributed package across the TGs. 𝜋2 offers small indemnities and the premiums collected from the TGs.
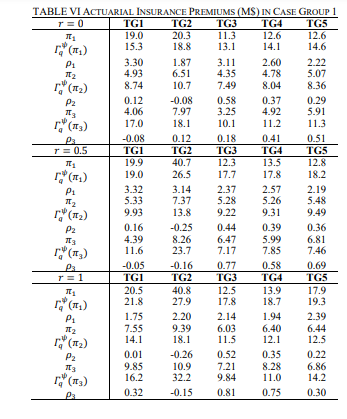
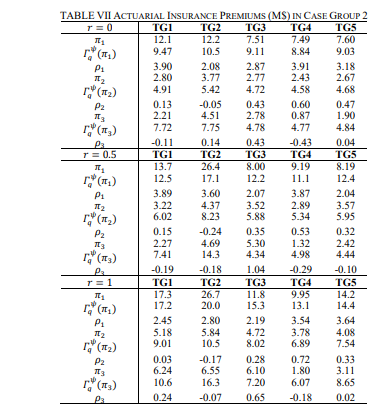
𝜌2 of some TGs can be slightly negative with indemnities supplemented by other TGs. However, the worse risk of 𝜋2 beyond expected losses could barely be covered. 𝜋3 rewards TGs of relatively low risk loading with high indemnities. While 𝜋1 provides higher indemnities than 𝜋3 , 𝜋3 offers comparable affordability to the coalitional platform of 𝜋2 . The proposed 𝜋3 substantially alleviates the insolvency hazard of 𝜋2 . 𝜌2 spans from -0.26 to 0.58. By contrast, 𝜌3 is dispersed in [-0.16 0.81], a typical range of risk loading. 𝜋3 offers a wider margin in risk loading than 𝜋2 to guarantee sufficient budget to cover individual risk.
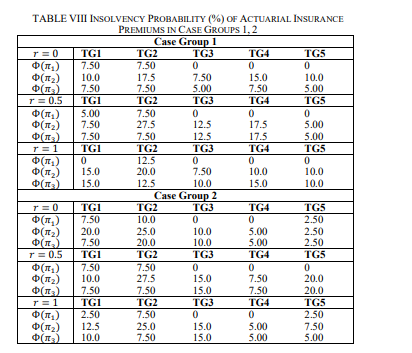
In Table VII, risk loading in Case Group 2 generally increase due to the enhanced security measure that reduces tail risk profile. 𝜌1 has a maximum close to 4 and could be too high to motivate entities to participate in. 𝜋2 is evenly distributed against average risk, with 𝜌2 lying in [-0.24 0.72]. 𝜋3 renders ideal risk loading 𝜌3 to rarely exceed 1. High capacity of indemnity and low risk loading make the proposed 𝜋3 a potentially compelling insurance model in practice. The probability of insolvency Φ(𝜋) is another risk measure which quantifies the capability of the insurance to mitigate the insolvency. Φ(𝜋) is defined as the probability that the loss is greater than the indemnity: Φ(𝜋) = Pr[ℒ𝑞 > 𝛤𝑞 𝜓 (𝜋)] (14) As shown in Table VIII, in Case Group 1, 𝜋1 generally provides the best insolvency alleviation with lowest probabilities of insolvency. In fact, 𝜋1 is such a conversative premium design against risk that the insolvency in some cases is 0. While 𝜋3 leads to the insolvency being lower than 𝜋2 and greater than 𝜋1 , 𝜋3 has the affordability superior to 𝜋1 .
In Case Group 2, when the cyber risk is significantly reduced, 𝜋3 can restrain the insolvency to be about as low as that of 𝜋1 . Thus, 𝜋3 offers an economical option with relatively sufficient insolvency mitigation.
CONCLUDING REMARKS
In this paper, a mutual insurance premium principle is designed to fairly share cyber risks across the participating TGs and control the overall insolvency risk. This study is among the first endeavors to approach the cyber-insurance by estimating the insolvency. In the case studies, it is shown the smart monitoring and job thread assignment solutions can work standalone or together to boost the reliability of TGs. Reduced insolvency probability is offered by the proposed Shapley premium while remaining as affordable as the coalitional 11 premium. More challenges may occur when real-life variables are factored in.
Since any two power system servers are to some extent connectable from each other, establishing the topology of cyber node connections could be complicated. Selecting weights to prioritize the crucial edges in the cyber node graph could be essential. There are also challenges on the actuarial end. First, accurate cyber risk estimation for specific systems would rely on long-term historical data set collection. How much risk loading a premium design reserved should be sufficient against tail risk is still left to further exploration. Second, the proposed Shapley insurance scheme is designed to achieve two goals: insolvency risk control and fair distribution of indemnity. Although these goals are achieved most of the time, there are exceptions especially when some participants are struck by unexpectedly high losses due to inadequate self-protection. This shall motivate future work in designing more insurance schemes to reflect selfprotection level and thus incentivize cyber-security investment.
REFERENCES:
[1] R. V. Yohanandhan, R. M. Elavarasan, P. Manoharan, and L. Mihet-Popa, “Cyber-Physical Power System (CPPS): A review on modeling, simulation, and analysis with cyber security applications,” IEEE Access, vol. 8, pp. 151019–151064, 2020, doi: 10.1109/ACCESS.2020.3016826.
[2] M. Barrett, Framework for Improving Critical Infrastructure Cybersecurity, Version 1.1, NIST Cybersecurity Framework, 2018. [Online]. Available: https://doi.org/10.6028/NIST.CSWP.04162018
[3] A. Huseinović, S. Mrdović, K. Bicakci, and S. Uludag, “A survey of denial-of-service attacks and solutions in the smart grid,” IEEE Access, vol. 8, pp. 177447–177470, 2020, doi: 10.1109/ACCESS.2020.3026923.
[4] J. Hong, R. F. Nuqui, A. Kondabathini, D. Ishchenko, and A. Martin, “Cyber attack resilient distance protection and circuit breaker control for digital substations,” IEEE Transactions on Industrial Informatics, vol. 15, no. 7, pp. 4332–4341, Jul. 2019, doi: 10.1109/TII.2018.2884728.
[5] H. Lin, Z. T. Kalbarczyk, and R. K. Iyer, “RAINCOAT: Randomization of network communication in power grid cyber infrastructure to mislead attackers,” IEEE Transactions on Smart Grid, vol. 10, no. 5, pp. 4893–4906, Sept. 2019, doi: 10.1109/TSG.2018.2870362.
[6] T. Duan et al., “Intelligent processing of intrusion detection data,” IEEE Access, vol. 8, pp. 78330–78342, 2020, doi: 10.1109/ACCESS.2020.2989498.
[7] L. Wei, A. I. Sarwat, W. Saad, and S. Biswas, “Stochastic games for power grid protection against coordinated cyber-physical attacks,” IEEE Transactions on Smart Grid, vol. 9, no. 2, pp. 684–694, Mar. 2018, doi: 10.1109/TSG.2016.2561266.
[8] A. Binbusayyis and T. Vaiyapuri, “Identifying and benchmarking key features for cyber intrusion detection: An ensemble approach,” IEEE Access, vol. 7, pp. 106495–106513, 2019, doi: 10.1109/ACCESS.2019.2929487.
[9] K. Yamashita et al., “Measuring systemic risk of switching attacks based on cybersecurity technologies in substations,” IEEE Transactions on Power Systems, vol. 35, no. 6, pp. 4206–4219, Nov. 2020, doi: 10.1109/TPWRS.2020.2986452.
[10] K. Huang, C. Zhou, Y. Qin, and W. Tu, “A game-theoretic approach to cross-layer security decision-making in industrial cyber-physical systems,” IEEE Transactions on Industrial Electronics, vol. 67, no. 3, pp. 2371–2379, Mar. 2020, doi: 10.1109/TIE.2019.2907451.
[11] M. Li et al., “Hybrid calculation architecture of cyber physical power system based on correlative characteristic matrix model,” in Proc. IEEE CYBER, 2018, pp. 584–588, doi: 10.1109/CYBER.2018.8688204.
[12] Y. Chen, J. Hong, and C.-C. Liu, “Modeling of intrusion and defense for assessment of cyber security at power substations,” IEEE Transactions on Smart Grid, vol. 9, no. 4, pp. 2541–2552, Jul. 2018, doi: 10.1109/TSG.2016.2614603.
[13] B. Cai et al., “Application of Bayesian networks in reliability evaluation,” IEEE Transactions on Industrial Informatics, vol. 15, no. 4, pp. 2146–2157, Apr. 2019, doi: 10.1109/TII.2018.2858281.
[14] B. Falahati, Y. Fu, and M. J. Mousavi, “Reliability modeling and evaluation of power systems with smart monitoring,” IEEE Transactions on Smart Grid, vol. 4, no. 2, pp. 1087–1095, Jun. 2013, doi: 10.1109/TSG.2013.2240023.
[15] P. Ghazizadeh et al., “Reasoning about mean time to failure in vehicular clouds,” IEEE Transactions on Intelligent Transportation Systems, vol. 17, no. 3, pp. 751–761, Mar. 2016, doi: 10.1109/TITS.2015.2486523.
[16] M. Xu and L. Hua, “Cybersecurity insurance: Modeling and pricing,” North American Actuarial Journal, vol. 23, no. 2, pp. 220–249, 2019.
[17] P. Lau et al., “A cybersecurity insurance model for power system reliability considering optimal defense resource allocation,” IEEE Transactions on Smart Grid, vol. 11, no. 5, pp. 4403–4414, Sept. 2020, doi: 10.1109/TSG.2020.2992782.
[18] P. Lau et al., “A coalitional cyber-insurance design considering power system reliability and cyber vulnerability,” IEEE Transactions on Power Systems, vol. 36, no. 6, pp. 5512–5524, Nov. 2021, doi: 10.1109/TPWRS.2021.3078730.
[19] I. Vakilinia and S. Sengupta, “A coalitional cyber-insurance framework for a common platform,” IEEE Transactions on Information Forensics and Security, vol. 14, no. 6, pp. 1526–1538, Jun. 2019, doi: 10.1109/TIFS.2018.2881694.
[20] D. Monderer, D. Samet, and L. S. Shapley, “Weighted values and the core,” International Journal of Game Theory, vol. 21, no. 1, pp. 27–39, 1992.
[21] S. Béal et al., “The proportional Shapley value and applications,” Games and Economic Behavior, vol. 108, pp. 93–112, 2018, doi: 10.1016/j.geb.2017.08.010.
[22] E. Algaba, V. Fragnelli, and J. Sánchez-Soriano, Handbook of the Shapley Value. Boca Raton, FL, USA: CRC Press, 2019.
[23] B. Falahati and Y. Fu, “Reliability assessment of smart grids considering indirect cyber-power interdependencies,” IEEE Transactions on Smart Grid, vol. 5, no. 4, pp. 1677–1685, Jul. 2014, doi: 10.1109/TSG.2014.2310742.
[24] M. Schiffman, “Common Vulnerability Scoring System (CVSS).” [Online]. Available: http://www.first.org/cvss/
[25] Y. Satotani and N. Takahashi, “Depth-first search algorithms for finding a generalized Moore graph,” in Proc. TENCON, 2018, pp. 832–837, doi: 10.1109/TENCON.2018.8650418.
[26] C. Wang et al., “Impacts of cyber system on microgrid operational reliability,” IEEE Transactions on Smart Grid, vol. 10, no. 1, pp. 105–115, Jan. 2019, doi: 10.1109/TSG.2017.2732484.
[27] Z. Yang, C. Ten, and A. Ginter, “Extended enumeration of hypothesized substation outages incorporating overload implication,” IEEE Transactions on Smart Grid, vol. 9, no. 6, pp. 6929–6938, Nov. 2018, doi: 10.1109/TSG.2017.2728792.
[28] C.-W. Ten et al., “Impact assessment of hypothesized cyberattacks on interconnected bulk power systems,” IEEE Transactions on Smart Grid, vol. 9, no. 5, pp. 4405–4425, Sept. 2018, doi: 10.1109/TSG.2017.2656068.
[29] C. Barrows et al., “The IEEE reliability test system: A proposed 2019 update,” IEEE Transactions on Power Systems, vol. 35, no. 1, pp. 119–127, Jan. 2020, doi: 10.1109/TPWRS.2019.2925557.
[30] G. Cao et al., “Operational risk evaluation of active distribution networks considering cyber contingencies,” IEEE Transactions on Industrial Informatics, vol. 16, no. 6, pp. 3849–3861, Jun. 2020, doi: 10.1109/TII.2019.2939346.
Authors:
Pikkin Lau, Student Member, IEEE, Lingfeng Wang, Senior Member, IEEE, Wei Wei, Zhaoxi Liu, Member, IEEE, and Chee-Wooi Ten, Senior Member, IEEE
This paper is
[story continues]
tags