
In our previous article, we discussed the importance of integrating corporate information systems and how this can give businesses a competitive edge. We introduced the basics of system integration and its main tasks. We talked about how Event-driven architecture (EDA), ETL (Extract, Transform, Load), Enterprise Service Bus (ESB), and API Gateways can help solve integration challenges. We also looked at common issues and explored examples of software architectures that can be used for integration.
In this new article, we'll focus on a critical task in system integration: improving how we manage data and bringing together data from different sources to provide a single access point to this information. We'll go into detail on how Event-driven architecture (EDA) and the ETL process can be used in this context. We'll also look at various high-level architecture designs and discuss how they can address frequent integration challenges.
Content Overview
-
Definition of Data Management and Consolidation in the Integration of Corporate Information Systems
-
Example of using ETL processes for business analytics improvements in e-commerce
-
Architecture of the ETL Process for Enhanced Data Management
-
Data Warehouses
-
Leveraging Apache Spark for Predictive Analytics in E-commerce
-
Using Kafka Streams for Enhanced Data Management
-
Conclusion
Definition of Data Management and Consolidation in Integration of Corporate Information Systems
In the realm of corporate information systems, integration serves a crucial role in improving how we handle and oversee data. This process involves merging data from diverse sources into a single, coherent system, ensuring that all users have access to the same, up-to-date information. The end goal is to maintain data that is both accurate and consistent, which is essential for making informed decisions. This task, known as data management and consolidation, is not just about bringing data together; it's about ensuring the data is reliable, readily available, and structured in a way that supports the company's operations and strategic objectives.
By consolidating data, we aim to eradicate inconsistencies and redundancies, which not only enhances the integrity of the data but also streamlines workflows and analytics. It lays the groundwork for advanced data utilization techniques such as predictive analytics, machine learning models, and real-time decision-making support systems. Effective data management and consolidation require the implementation of robust ETL processes, middleware solutions like ESBs, and modern data platforms that support Event-driven architectures. These technologies and practices form the backbone of a responsive and agile data ecosystem. They enable organizations to rapidly adapt to new data sources and business needs, ensuring that the information system evolves in alignment with corporate growth and technological advancements.
Example of using ETL processes for business analytics improvements in e-commerce
Consider the case of an e-commerce company looking to enhance its business analytics. To effectively perform analytics, it's essential to have access to data regarding sales, orders, inventory, and supplies. Often, this data is scattered across various systems, such as Customer Relationship Management (CRM), Enterprise Resource Planning (ERP), and warehouse management systems (WMS).
To gain a comprehensive understanding and improve data management, it's necessary to consolidate this data from all these sources into a single access point. ELT (Extract, Load, Transform) or ETL (Extract, Transform, Load) tools can be employed for this purpose. For instance, ETL tools like Apache NiFi, Talend, or Pentaho facilitate data extraction from different sources, transformation into a unified format, and loading into a designated database. This unified data repository then becomes a single point of access for analysis and decision-making.
Once the data is loaded into the target database, data analysis tools like Tableau or Power BI can perform analyses and generate reports based on the consolidated data. These tools offer data visualization capabilities, allowing for the creation of dashboards and real-time data analysis.
In addition to ETL/ELT tools, data processing and analysis tools are also crucial in handling and interpreting the collected data. Some of these include:
- Apache Spark - An open-source platform for large-scale data processing that enables real-time data operations.
- Tableau - A data visualization program that integrates data from multiple sources and provides interactive dashboard and report creation.
- Apache Hadoop - An open-source framework for processing and analyzing large volumes of data, ensuring scalability and reliability from various data sources.
- Power BI - A business analytics tool allowing real-time report and dashboard creation from diverse data sources.
Leveraging these data analysis tools enables more efficient processing and analysis of data from varied sources, leading to better data management and more informed decision-making in business.
Architecture of the ETL Process for Enhanced Data Management
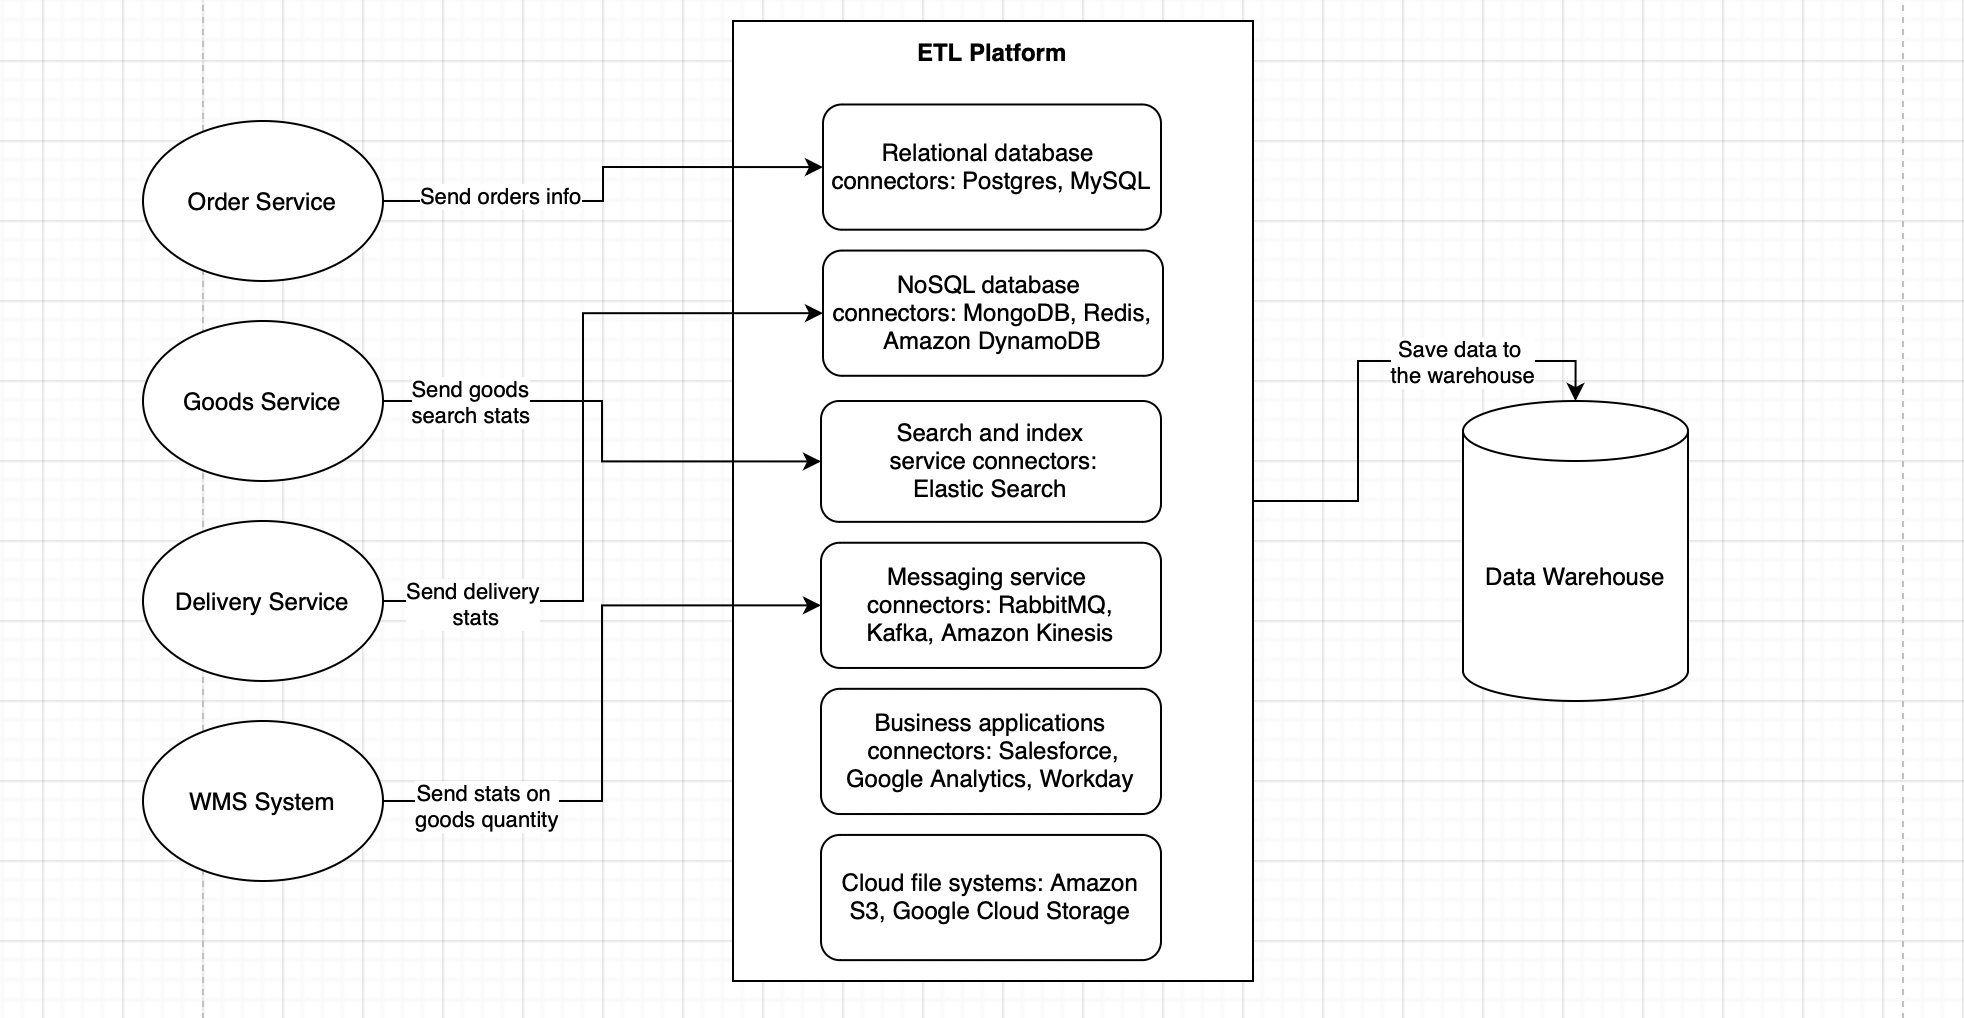
The diagram illustrates a high-level ETL (Extract, Transform, Load) process architecture designed to streamline data management across various corporate systems. Below is a detailed breakdown of each component within the architecture.
Data Sources — encompasses various data origins, such as databases, web services, file systems, and other applications or systems that house pertinent information.
These sources include:
- Order Service: Sends information about customer orders.
- Goods Service: Transmits statistics related to product searches.
- Delivery Service: Provides statistics on delivery metrics.
- WMS System: Dispatches information regarding inventory levels.
ETL Platform — At the heart of the architecture, the ETL platform carries out key operations to enhance data management. It performs the following tasks:
- Extracts data from the sources mentioned above.
- Transforms this data by cleaning, aggregating, and filtering to meet the desired format and structure.
- Loads the processed data into a target data warehouse for centralized storage and access.
The platform includes connectors for various data sources, such as:
- Relational Database Connectors: Interfaces with SQL databases like PostgreSQL and MySQL.
- NoSQL Database Connectors: Communicates with databases like MongoDB, Redis, and Amazon DynamoDB.
- Search and Index Service Connectors: Connects with services like Elastic Search for data indexing and retrieval.
- Messaging Service Connectors: Includes integration points for message brokers like RabbitMQ, Kafka, and Amazon Kinesis.
- Business Applications Connectors: Interfaces with business apps such as Salesforce, Google Analytics, and Workday.
- Cloud File Systems: Works with cloud storage solutions like Amazon S3 and Google Cloud Storage.
Data Warehouse — acts as the centralized repository where consolidated data from various sources is stored and made available for usage. The data warehouse can be implemented using relational databases or specialized data warehouse technologies.
Users/Applications — representing the end-users or applications that access data from the warehouse. These could be data analysts, managers, business users, or other systems that leverage the data for decision-making, reporting, analytics, and other business processes.
The ETL process runs at scheduled intervals, ensuring data within the warehouse is continually updated and kept current. Throughout the ETL process, data undergoes various stages, including extraction, transformation, and loading, which allows for effective data processing and preparation for further use.
Such architecture facilitates improved data management by combining different data sources into a single, accessible, and reliable source. This ensures data consistency, accuracy, and timeliness for decision-making and business process analysis. By automating the ETL process, maintaining an explicit data structure, and applying appropriate tools, an enterprise can achieve more efficient data management, reduce data preparation time, and improve information accuracy and reliability.
Furthermore, this architecture provides unified data access to different user groups and applications within the organization. It fosters reduced data duplication, increased information utilization, and improved collaborative work.
Lastly, centralized data storage and management ensure compliance with security and confidentiality requirements. Audit and access control to data become more convenient and effective, helping to mitigate risks associated with data breaches or improper data use. Overall, the ETL process architecture for enhanced data management is a critical tool for enterprises aiming to elevate the quality and value of their data, improve decision-making, and boost the efficiency of business processes.
The use of Apache Spark or Talend for ETL/ELT processes can be illustrated as follows:
-
Data Loading: The initial stage involves loading data from various sources such as databases, files, data streams, etc. With Apache Spark, you can use its capabilities to read data from different sources like Apache Kafka, Hadoop HDFS, Amazon S3, and others. Talend also offers a wide range of connectors for various data sources.
-
Data Transformation: After data loading, it must be transformed according to the required format and structure. Apache Spark and Talend provide powerful capabilities to perform various data transformations, including filtering, sorting, aggregation, data type conversion, and many other operations. You can use Spark SQL to perform SQL queries over the data or utilize Talend's specific operators and functions for data transformation.
-
Data Loading: The next step after data transformation is loading the data into a target system or data warehouse. Apache Spark offers various capabilities to write data into different destinations, such as databases, file systems, Apache Kafka, and others. Talend also provides a wide range of connectors for loading data into different systems.
-
Monitoring and Management: An essential aspect of ETL/ELT processes is the monitoring and management of the processes. Apache Spark and Talend provide tools for monitoring task execution, error control, and process performance. You can use built-in monitoring and logging mechanisms or integrate these tools with external monitoring systems.
The advantages of using Apache Spark or Talend for ETL/ELT processes include:
- High performance and scalability for processing large volumes of data.
- Distributed data processing allows computations to be performed in parallel across a cluster of servers.
- Rich functionality for data transformation and complex operations.
- A wide selection of connectors for data ingestion and export.
After data transformation, there are several possible target systems where the data can be loaded:
-
Relational Databases: Data can be loaded into relational databases such as MySQL, PostgreSQL, Oracle, Microsoft SQL Server, and others. In this case, the data will be available for analysis and use with SQL queries.
-
Data Warehouses: There are specialized data warehouses like Apache Hadoop HDFS, Apache Hive, Amazon Redshift, Google BigQuery, and others designed for storing and analyzing large volumes of data. Data can be loaded into such warehouses for subsequent analysis and use.
-
Cloud Data Storage: Data can be loaded into cloud storage such as Amazon S3, Google Cloud Storage, Microsoft Azure Blob Storage, and others. This allows storing data in the cloud and using it in various analytical and cloud services.
-
File Systems: Data can be saved in file systems like the local file system or distributed file systems such as Hadoop Distributed File System (HDFS). This can be useful for further data processing by other tools or analytical systems.
-
Streaming Systems: In some cases, data can be loaded into streaming systems like Apache Kafka or Apache Pulsar for real-time data analysis and processing in a stream.
Data Warehouses
The Data Warehouse is a centralized data repository that consolidates data from various sources in one place to support analytical processing and decision-making in an organization. It provides consolidation, integration, and structuring of data to ensure high-level data access and analysis.
The Data Warehouse has the following characteristics:
-
Centralized Data Storage: The Data Warehouse combines data from various sources, such as operational databases, files, external systems, and others, and stores it in one place.
-
Optimized for Analytical Processing: The Data Warehouse is designed and optimized for executing complex analytical queries and data aggregation operations, making it effective for analysis and decision-making.
-
Data Structuring and Transformation: Data in the Data Warehouse typically undergoes a transformation and structuring process to ensure a unified format, consistency, and data quality.
-
Historical Data: The Data Warehouse contains historical data, allowing for trend analysis and comparative analysis based on past events and indicators.
It provides a range of benefits:
-
Data Consolidation: It allows combining data from different sources, simplifying analysis, and creating composite reports.
-
Unambiguity and Consistency of Data: The Data Warehouse provides a single definition of data, eliminating problems of inconsistency and various versions of data.
-
Enhanced Analytics Capabilities: Thanks to its optimized structure and organization of data, the Data Warehouse provides fast access and high-level data analysis capabilities.
-
Improved Decision Making: Analytics based on data from the Data Warehouse helps make more informed decisions, relying on reliable and accurate data.
A popular tool for building and managing Data Warehouses is Snowflake. Snowflake is a cloud platform for data storage, analysis, and processing that offers powerful capabilities for building and managing Data Warehouses. It is distinguished by its flexibility, scalability, and performance, as well as providing convenient tools for working with data.
Here are some features of Snowflake:
-
Cloud Architecture: Snowflake operates on a cloud computing platform and stores data in the cloud. This allows for easy data warehouse scaling as needed and provides high data availability and reliability.
-
Separation of Storage and Computation: Snowflake separates data storage from the analysis and processing process. This allows for scaling computational resources independently from the volume of data, ensuring high performance and flexibility.
-
Virtualized Data Access: Snowflake provides virtualized access to data from various sources. This means that data can be consolidated and analyzed without physical movement and duplication of data.
-
Multilevel Data Security: Snowflake provides a high level of data security. It supports data encryption at rest and in transit, provides access management and auditing capabilities, and complies with numerous security standards.
-
Ease of Use and Administration: Snowflake offers a simple and intuitive SQL interface for data management. It also has convenient tools for managing and monitoring the data warehouse.
Snowflake is becoming an increasingly popular choice for many companies, especially those looking to adopt a cloud architecture and flexible scaling of their Data Warehouses. It offers powerful data analytics and processing capabilities, ensuring high performance and reliability.
Leveraging Apache Spark for Predictive Analytics in E-commerce
In the context of our ETL process architecture focused on enhancing data management, we leverage Apache Spark for its powerful data processing and machine learning capabilities. Here, we provide a Java code example demonstrating how Spark can be used for predictive analytics in inventory management for an e-commerce company.
The given Java code example illustrates a use case where Apache Spark's data processing and machine learning capabilities are applied to predict inventory requirements for an e-commerce company. This scenario addresses the task of correlating web analytics data, specifically product page visits, with inventory levels to anticipate product demand.
The primary objective is to analyze visitation patterns from Google Analytics and use historical conversion rates to forecast future sales. By predicting these sales, the company can make informed decisions about inventory management, ensuring they have sufficient stock to meet anticipated demand while avoiding overstocking.
It's important to note that this code is provided as a conceptual framework rather than a fully operational script. It serves to demonstrate the general workflow rather than to be executed as-is in a production environment. The example omits several practical concerns that need to be addressed in a real-world application, such as authentication and authorization, database management, error handling and logging, and complex analytics.
This code snippet uses Spark's DataFrame API to load and transform data from Google Analytics concerning product page visits. It then aggregates this data by product to get a total count of visits. Further, we assume that a separate DataFrame contains historical conversion rates and actual sales data. This historical data is joined with the aggregated visit data to provide a basis for our prediction model.
The VectorAssembler is a feature transformer that merges multiple columns into a vector column. This is a necessary step before applying machine learning algorithms in Spark, which require features to be presented in this format.
We employ a LinearRegressionModel from Spark MLlib to predict future sales based on page visits and conversion rates. It’s assumed that the model is trained with our prepared dataset and then used to predict next month's sales, which are crucial for determining inventory needs. Once the prediction is made, we display the output for review.
The following code encapsulates this process:
import org.apache.spark.api.java.JavaRDD;
import org.apache.spark.api.java.JavaSparkContext;
import org.apache.spark.ml.regression.LinearRegressionModel;
import org.apache.spark.ml.regression.LinearRegression;
import org.apache.spark.ml.feature.VectorAssembler;
import org.apache.spark.ml.linalg.Vectors;
import org.apache.spark.ml.linalg.Vector;
import org.apache.spark.sql.Dataset;
import org.apache.spark.sql.Row;
import org.apache.spark.sql.SparkSession;
import org.apache.spark.sql.functions;

public class SparkDataAnalytics {

    public static void main(String[] args) {
        // Initialize SparkSession
        SparkSession spark = SparkSession
                .builder()
                .appName("Spark Data Analytics for Inventory Prediction")
                .getOrCreate();

        // Load data from Google Analytics into a DataFrame
        Dataset<Row> visitsDF = spark.read().format("csv")
                .option("header", "true")
                .load("path/to/google_analytics_data.csv");

        // Aggregate page visit data by product
        visitsDF.createOrReplaceTempView("product_visits");
        Dataset<Row> aggregatedData = spark.sql(
            "SELECT product_id, COUNT(*) as total_visits " +
            "FROM product_visits " +
            "GROUP BY product_id"
        );

        // Load historical conversion rates and sales data into another DataFrame
        Dataset<Row> conversionRatesDF = spark.read().format("csv")
                .option("header", "true")
                .load("path/to/conversion_rates.csv");

        // Join the visit data with the conversion rates
        Dataset<Row> joinedData = aggregatedData.join(conversionRatesDF, "product_id");

        // Prepare the data for the Linear Regression model
        VectorAssembler assembler = new VectorAssembler()
                .setInputCols(new String[]{"total_visits", "conversion_rate"})
                .setOutputCol("features");
        Dataset<Row> finalData = assembler.transform(joinedData);

        // Train the Linear Regression model
        LinearRegression lr = new LinearRegression()
                .setLabelCol("next_month_sales")
                .setFeaturesCol("features");
        LinearRegressionModel lrModel = lr.fit(finalData);

        // Predict next month's sales using the trained model
        Dataset<Row> predictions = lrModel.transform(finalData);

        // Display the predictions
        predictions.show();

        // Terminate the Spark session
        spark.stop();
    }
}
In this example, we read CSV files representing Google Analytics data and historical sales data. After performing SQL-like transformations and aggregations using Spark SQL, we prepare the data for machine learning. A linear regression model is trained and used to predict future inventory requirements based on current trends.
This code example, placed within the context of the detailed ETL architecture previously described, illustrates how an ETL process can be enhanced with data analytics capabilities to support strategic business decisions in inventory management. By integrating this predictive analytics process into their data pipeline, businesses can achieve a more dynamic and responsive inventory management system, ultimately reducing both overstock and stockouts, and ensuring better customer satisfaction.
Using Kafka Streams for Enhanced Data Management
In addition to the ETL framework outlined earlier, Kafka Streams offers a powerful solution for unifying data from disparate sources and ensuring cohesive data access. Kafka Streams is a library for building applications capable of processing data in real time, aggregating from multiple sources, and thereby facilitating immediate data analysis, transformations, and complex computations while ensuring system availability and resilience.
Kafka Streams can be employed to address various tasks related to data stream processing, including the enhancement of data management. In our scenario, Kafka Streams processes data from diverse origins and consolidates it into a singular database that serves as the cornerstone for reporting and analytics.
Consider the following example of Kafka Streams architecture used for enhancing data management which involves multiple data sources containing a company's financial metrics, such as accounting reports, sales data, and expense records: 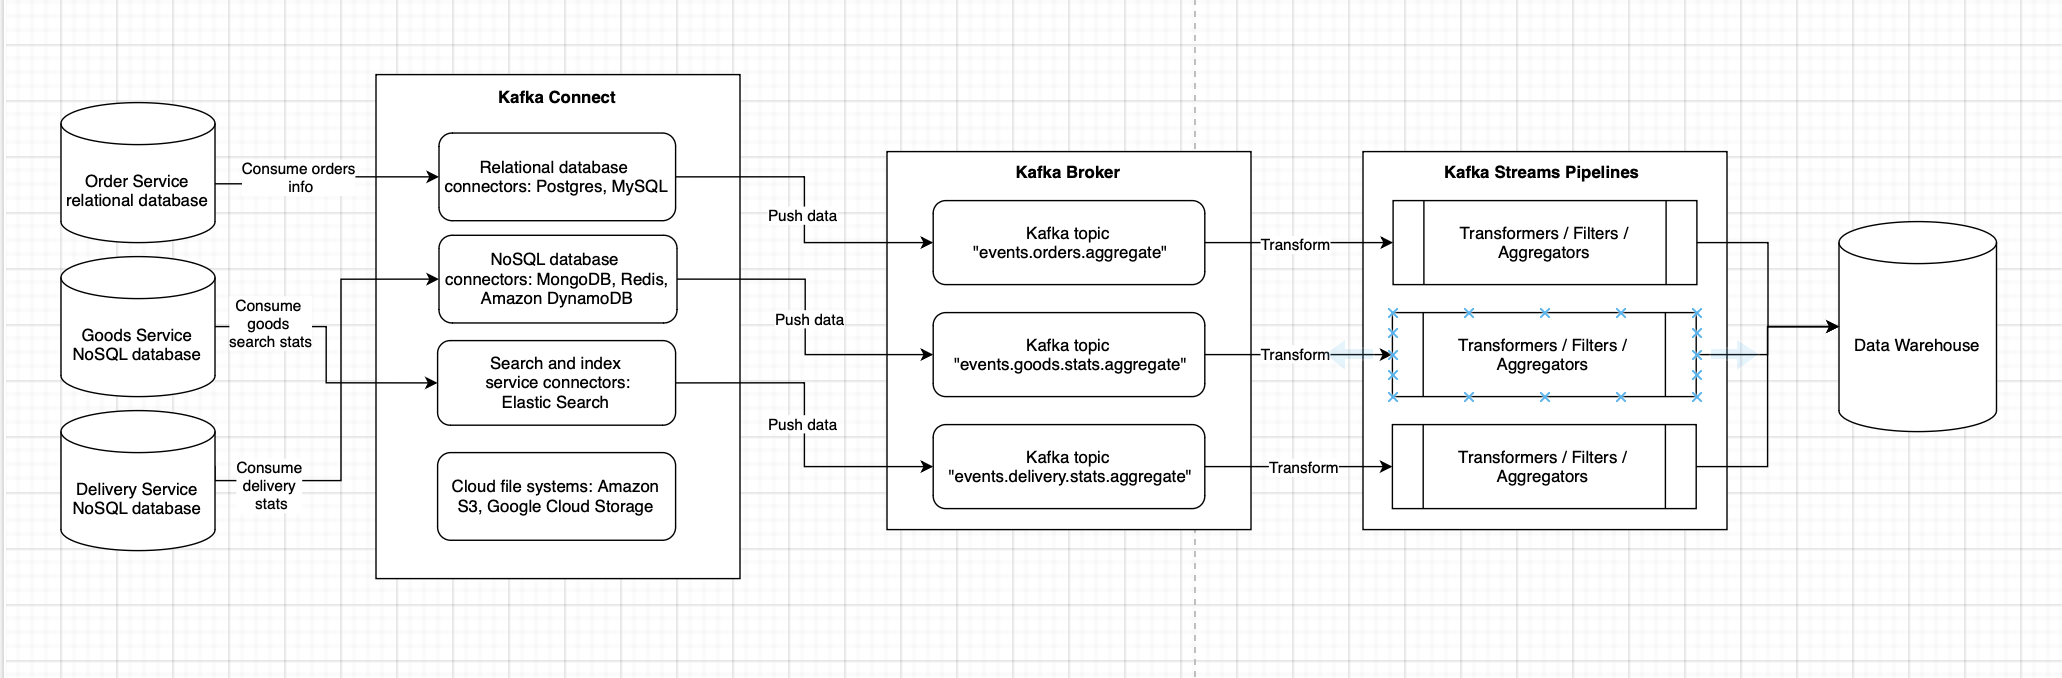
Each data source is connected to Kafka, with data streaming as a sequence of messages. Kafka Streams can then be used for real-time data streams merging, filtering, aggregation, transformation, and conversion. For instance, data can be aggregated by months or quarters, calculations performed, and data transformed into a format suitable for reporting.
Once the data has been processed and transformed, it can be stored in a centralized database used for reporting. Utilizing Kafka Streams alongside Apache Kafka can ensure high system availability and fault tolerance, as well as scalability and real-time distributed data processing.
In this architecture, multiple data sources are connected to Kafka, which could be various systems or databases holding company financial metrics. Data from these sources are transmitted to Kafka as a stream of messages organized into topics. Kafka provides a robust and scalable transmission of data and maintains them in a streaming fashion.
For instance, Kafka Streams can aggregate financial metrics over specific time intervals, filter out irrelevant data points, and enrich datasets by joining related data from multiple streams. These processes culminate in a centralized database that not only supports comprehensive reporting but also empowers decision-making with up-to-date and actionable insights.
The real-time processing capabilities of Kafka Streams are instrumental in enabling businesses to swiftly adapt to changes and make timely, data-driven decisions. The distributed nature of Kafka, coupled with the scalability of Kafka Streams, ensures high availability and fault tolerance.
Kafka Streams pipelines, as depicted in the diagram above, are highly customizable sequences of operations.
They include:
- Data Aggregation: Read data from a Kafka topic, group by key, perform an aggregation function for each key, and write the aggregated results to a new Kafka topic or database.
- Data Filtering: Read data from a Kafka topic, apply a condition or filter to each data record, and write the filtered data to a new Kafka topic or database.
- Data Transformation: Read data from a Kafka topic, change the data structure, format, or type, and write the transformed data to a new Kafka topic or database.
- Data Enrichment: Read data from multiple Kafka topics, join data based on keys or other associations, enrich data from one topic with data from another, and write the enriched data to a new Kafka topic or database.
- Distributed Computing: Read data from a Kafka topic, split data into multiple processing streams, perform distributed computations on data in each stream, combine the results, and write the processed data to a new Kafka topic or database.
Furthermore, the architecture supports a variety of Kafka Connectors, allowing for seamless integration with external systems and services. Connectors such as JDBC for databases, Elasticsearch for search and analytics, Kinesis for AWS data streaming, and InfluxDB for time-series data, exemplify the extensibility of Kafka Streams to accommodate diverse data ecosystems.
This architecture, tailored to organizational needs, underscores Kafka Streams as a versatile solution that enhances data management. It reduces the time required for data collection and consolidation, provides uniform data access, and facilitates real-time data analysis, proving indispensable across various domains such as e-commerce, finance, and media.
By deploying Kafka Streams architecture, enterprises can not only streamline their data management practices but also evolve into more agile, data-centric organizations ready to leverage real-time analytics for strategic advantage.
Conclusion
In conclusion, the integration of corporate information systems through robust ETL frameworks and real-time data processing with Kafka Streams represents a transformative approach to data management. We've explored the intricate processes of data extraction, transformation, and loading, and we've delved into the capabilities of Kafka Streams to unify and analyze data streams for insightful decision-making. The architectural examples and code snippets provided serve as a blueprint for building scalable, fault-tolerant systems that can handle the complex data needs of modern enterprises.
As businesses continue to navigate an ever-expanding data landscape, the methods and tools discussed here offer a pathway to more efficient data management, enabling organizations to harness the true power of their data assets. The strategic integration of these systems is not just about managing data; it's about unlocking opportunities for innovation and growth in an increasingly data-driven world.
[story continues]
tags