This is an augmentation article to the one which Mr. Karim has elaborated upon in couchbase blog. If you haven’t read that article it’s better to take a look at it also, so that we can elaborate on in-depth concepts in this article based on what you have learnt from that article. As clear from the title this piece is aimed to dive deep into creating robust solutions for such tools being integrated with basic system design principles. As however cool these hacker like tools may look they must be robust and should be able to scale up to the organizations need. This article can be interpreted as a case-study for Prometheus and Grafana integration with Couchbase-Exporter.
Who is the target audience ?
Any industry professional or developer who wants to use this integration of tools but can clearly see the salability ( more accurately, synchronization ) and automation flaws. Also, people who are genuinely interested in developing robust monitoring solutions that functions in an automated intelligent manner with minimal human intervention possible.
Definitive Key Takeaways
- An Automation solution approach and it’s implementation with total system failure analysis also.
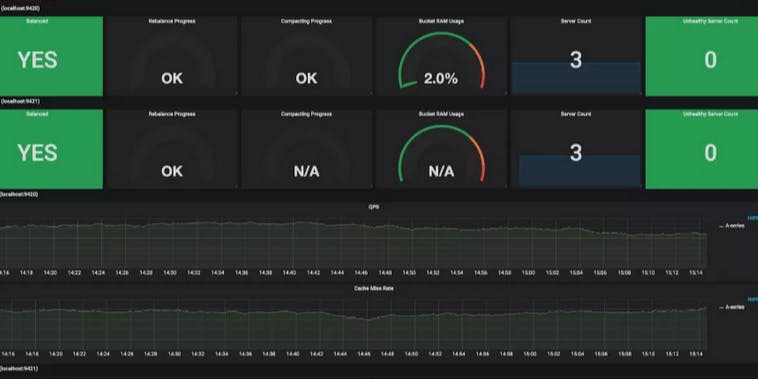
- Custom Grafana dashboards that are much more informative and expressive. Plus, the customization methodology for creating such dashboards.
- Service creation concepts and creating customization to Prometheus configuration files.
- Conceptual explanation of creating a high availability solution for Prometheus monitoring tool.
- Grafana: We do get a OOB dashboard that gets us stats at ‘instance’ level as defined variable in grafana. But, we do want variables to be present at different levels like bucket, node or cluster level. Also, we get 'instance’ name as ‘localhost:9422’ etc. but we might be interested in getting cluster names or something meaningful that makes sense to use while monitoring. Lastly, we definitely need newer metrics for making newer observations analysis as per our requirements.
- Prometheus: We need to restart it each and every-time we add new targets i.e. changes in configuration files are not detected dynamically, can we develop a method to not restart it every-time after adding new target. Also, can we have multiple attributes to our targets that hold a more apt description of instances that we are monitoring. What about alerts !! We definitely need them but it might have been out of scope for that article to make a discussion on writing alerting rules and combining it with AlertManager, which is a whole new separate module that can be attached to Prometheus tool. Yes, we would like to discuss it here. Very much 😉.
- Couchbase-Exporter: This exporter is quite sufficient and works great in every respect, plus is well coded with simple design. Here is the major issue considering customization scope that I feel points to quite a good limitation of this exporter of being restricted to only single client connection per instance for ReST endpoints of :8091 port-no only. There might be a need to monitor N1QL stats, Active requests which can only be queried through :8093 port-no, refer issue. Which this exporter won’t be handling in future either. But, we can still add other endpoints like monitoring indexes etc. We will discuss a methodology to successfully add them to couchbase-exporter too !!
Author Help Tip 1: If you are looking to customize only one specific tool then directly jump over to that section, read extensively & start experimenting with code base.Author Help Tip 2: This article requires practical hands on along the way. So, do refer to the github repository and try the codes yourself. If this article is not finished at a single sitting, take your time & get back. As, it is a reference guide created for developing completely custom monitoring and alerting solutions. It is a pretty exhausting piece to follow along. Hence, the virtue of patience would come in handyNow, if you have gone through the earlier mentioned article (Could not stress it enough to read it before !!). We can start with explaining the fundamentals concepts, customizations and improvements that can be made on the limitations of this conglomerate of multiple tools.
First, we’ll elaborate on the basic functioning of this integration of three tools namely couchbase-exporter, Prometheus, Grafana. Couchbase NoSQL document store provides us with ReST endpoints which anyone with proper credentials can access, refer documentation. Which couchbase-exporter utilizes to make queries let’s say for /pools/defaults to get the cluster related stats or information. These stats then are inserted into Prometheus datastore after which they are retrieved by Grafana for display by a data-source connection. The above statements summarizes what’s explained in the earlier mentioned article. But, we would like to take a complete in depth dive into the multiple components involved here.
Data Flow Sequence: Couchbase-Server -> Couchbase-Exporter -> Prometheus Datastore -> Grafana
The above paragraph explains the conceptual working and basic data flow of stats through multiple tools for monitoring in an abstract manner. Let’s see how technically this functionality is working with the below shown architecture diagram.
From this architecture diagram it is clear that the couchbase exporter process does require an empty port on the VM executing it. On which the couchbase-exporter process will listen to the fetch stats from ReST endpoints.
Also, the configuration file of Prometheus contains a list of targets that needs to manually update and the Prometheus process is needed to restarted with that configuration file being used for being able to detect the changes.
Finally, we need to import the grafana.json file corresponding to the couchbase-exporter tool that we’ll be using for displaying our metrics as dashboards.
If you are a beginner with using exporter tools and setting them up with Prometheus, it also provides other exporter options for multiple different databases too if you are interested. Now, having basic functioning of these monitoring processes in our mind we’ ll proceed with dissection part. Here, in the following sections the flaws in this out-of-the-box approach are highlighted and then we mitigate them step by step.
Let the dissection begin !!
Clearly we can see a lot of manual effort in this tool integration process from setting up the couchbase-exporter process to setting up Prometheus configuration files, it’s a lot to do.
With only manual intervention involved we can at max setup 10 or may be 20 Couchbase VMs by ourselves but that might not be enough at all for a platforms team responsible for taking care of all the applications running on Couchbase. So, this limit to manual effort for a given workforce also gives rise to the ‘limit in stability’ issue, even when Prometheus itself is highly scalable in nature.
We focus our efforts onto development of an automated solution which can keep track of VMs we have added or deleted for monitoring as per our need. With all that in hand, we can set up our couchbase-exporter processes and Prometheus targets from configuration files.
Adding more customization as per our need is also an issue with the earlier mentioned article as there is just no discussion about it. The article by Mr. Karim serves as an introductory exposure to working with these tools. This issue persists across all the three tools at different levels let’s address them one by one.
Another issue, where is the High Availability(HA) analysis for this tool. What if the VM running Prometheus goes down ? What will happen to our stats and metrics ? Will the alerts function as they are important for critical applications. As product owners we would like to know the state of the application servers, complete end-to-end loading and unloading state.
Lastly, scalability of this integration of tools. How, well does Prometheus scale ? Well, putting it simply, it scales quite well. Salability won’t be coming from Prometheus’s end at all.
How many simultaneous VMs can be put under observations, from couchbase-exporter end(well, less than 65535 VMs) ? Where does this integration start to break down etc. This analysis will be really helpful to deploy a fully scaled monitoring and alerting tool as per large scale industry requirements.
Have I talked about a complete system failure of all the tools. How to recover from that ? Don’t worry we’ll discuss that too.
In the following sections we will discuss multiple approaches mitigating above problems and provide appropriate source code snippets to implement those solutions also.
Learn more about your tools
Let’s discuss about few basics about each tool that must be known to get you started with mitigating strategies. There are few additional capabilities that each tool has which will help us design a complete monitoring and alerting solution. Each of these tools supports some basic customization abilities which when coalesced together does give rise to a much better overall solution. Let’s discuss customization capabilities for each tool one by one.
Add new variables and metrics for Grafana
Grafana: It does allow addition of new variables at bucket, node or instance/cluster level. We can do that by going to Settings -> Variables -> New Variable, the most important part is to write the query that will fetch bucket or node labels. Grafana also allows preview option with which we can check if the correct variable is getting fetched or not. Below are some sample queries to fetch these labels for our defined variables. These defined variables appear as a drop-down list at the top of the dashboard.
Queries are as follow:
1. For getting cluster names into the defined 'cluster' variable: "label_values(couchbase_bucket_basicstats_dataused_bytes, cluster)"
2. For fetching bucket names into the defined 'bucket' variable: "label_values(couchbase_bucket_basicstats_dataused_bytes{cluster="$cluster"}, bucket)"
3. For fetching VM names into the defined 'node' variable:: "label_values(couchbase_node_interestingstats_couch_spatial_data_size{cluster="$cluster"},node)"
In above queries we can see a trend that all metrics are obtained for a given instance(instance and cluster are used interchangeably, but all metrics are obtained for a given IP address only not cluster. See Issue).
Hence, to get metrics at bucket or node level we have to fix our instance/cluster in our query and get bucket or node information at that level for a specified metric of bucket or node level. See, 2nd and 3rd query. Now, we know that we can add our own custom variables.
Now, we will learn a much easier approach(when, you are used to it ! 😉) to add newer graphs into our Grafana dashboards. We need to learn how to create our very grafana.json file to import/upload containing the dash-boarding information.
This can either be done through building our own json from dashboard.jsonnet with the help of grafonnet library or we can directly start manipulating the grafana.json file that we can directly import our resultant dashboard. I prefer the second approach as it involves only copy pasting an element and changing a few attributes depending upon the metric like unique_id, query, legend, labels, title etc.
Here, refer this link to see the dashboards that I have created with new metrics and variables, but need your grafana instance on your VMs to open & upload/import them. First, import/upload them you will observe newer variables and newer metrics for observation.
There will be three files one a reference one & others are the custom modified one with variables defined by me. You can use diff comparator tool to see exactly what are the new changes made by me. If you are observing it as a standalone file you will see 6 newlines above & below every newer element that I have added, be it new variables or a new graph. Some graphs will display information at bucket level and others will display at node level.
Click here, and download the dashboards & try them for yourself on your end. This README.md provides information about editing these grafana dashboard files & in case of a query do revert back or create an issue on github. By reading this README file you will have a basic idea about adding new variables, graphs and most importantly writing PromQL queries for getting stats out of Prometheus for Grafana.
Making maximum out of Prometheus
Prometheus is a time-series datastore with multi-dimensional data model in which data is identified by key-value pair. It is also a single server node that is autonomous meaning there goes our High Availability for monitoring if used with default implementation. There, we clearly executed the Prometheus process with ./prometheus --config.file=prometheus.yml command. But, when it comes to linux, better make a service out of it, refer link. It helps in easing down the scripting tasks. Here is a sample service file for Redhat Linux and we need to paste this in /etc/systemd/system/ directory.
[Unit]
Description=Prometheus
Wants=network-online.target
After=network-online.target
[Service]
User=root
Group=root
Type=simple
ExecStart=/prometheus-2.9.2.linux-amd64/prometheus \
    --config.file /prometheus-2.9.2.linux-amd64/prometheus_cb.yml
[Install]
WantedBy=multi-user.target
README.md explains in detail with the workings of this service based Prometheus execution. With this we reduce our dependence on commands like nohup or keeping our terminal alive for this Prometheus to continue running which adds more robustness to our solution.
Now, ending our discussion on services and let’s give our Prometheus capabilities to analyze targets dynamically i.e. automatic detection of removal or addition of instances/targets without restarting our Prometheus service. It’s simply achieved with a module called
Node-ExporterAlso, we would like to add labels for our instances that are under observation like cluster name, application name etc. Also, a better design for configuration file which will exclude targets as we aim to scale it for at least 200 targets or much more. So, our configuration file remains light and easily readable. The target information will be picked from targets.json file and any addition/removal will be detected by Node Exporter only. Below, just observe our new config.yml file and targets.json file, can also refer link.
config.yml
global:
  scrape_interval:     10s
  evaluation_interval: 10s
# Alertmanager configuration
alerting:
  alertmanagers:
  - static_configs:
    - targets:
      - alertmanager:9093
rule_files:
- 'rules/*'
scrape_configs:
  - job_name: couchbase
    file_sd_configs:
    - files:
      - targets.json
Below, is
targets.json[
{
"labels": {
"cluster": "Cluster 37"
},
"targets": [
"localhost:9422"
]
},
{
"labels": {
"cluster": "Orphan VM"
},
"targets": [
"localhost:9421"
]
}
]We have completed our discussion on making a more automated solution for monitoring multiple scrape targets with Prometheus. Now, let's have a small discussion also raising alerts with Alert Manager and defining rules with Rule Manager.
Alerting, a whole new story of it’s own in Prometheus. Well it’s time to introduce a few diagrams to make sense of how Prometheus actually works at a higher level. BTW, for an in-depth theoretical analysis refer this link.
Picture-Credit: Prometheus Official documentation.
We can see that we can raise alerts with Alert Manager via push notifications on multiple platforms like email, webhook server etc. AlertManager is a separate module which will be again executed like Node Exporter only occupying its own port and does have it’s own UI plus a configuration file to set up the alerting mechanisms. It also de-duplicates the alerts and is having multiple other smart alerting features also.
This AlertManager raises alerts as per the rules specified in the configuration file of Prometheus service that we were executing earlier. Here, below is the internal architecture diagram of Prometheus and AlertManager working together in action. Later, we will discuss instructions to set this up easily with Prometheus.
Picture-Credit: Prometheus Official documentation.
RuleManger picks up the rule specified in the Prometheus configuration file and pushes those alerts into AlertManager that conveys those alerts across various mediums. To set up AlertManager, just extract the .tar.gz and execute the binary with command ./alertmanager --config.file=config.yml .
But, before that do configure the mediums with which you want to convey your alerts either by email(You’ll need to configure SMTP client for this.), slack, web-hook servers or anything else. Refer, documentation for detailed implementation and setup analysis of alert-manager. Finally, do specify the AlertManager that you are running in your configuration file. So, that Rule-manager can push any alert notifications into Alert-Manager for further proceedings.
Regarding defining custom rules for Prometheus, refer to this link from couchbase-exporter github repository. There are some by default rules already present that are excellent to get you started with respect to creating your own custom rules.
- alert: CouchbaseNotBalanced
    expr: couchbase_cluster_balanced == 0 and couchbase_task_rebalance_progress == 0
    for: 10m
    labels:
      severity: critical
    annotations:
      summary: 'Couchbase cluster is not balanced'
The above line from rules.yml file does tell us that we need to first define a label for alert. Most importantly an expression to be evaluated based on the metrics that are stored in the Prometheus server from couchbase-exporter. We also get to define the severity level and summary of the alert.
After creating your rules do add them to your configuration file for Prometheus as you can also see in the earlier specified Prometheus configuration file in the above section. I have tried to summarize as much content as possible here, in case of any issue, do comment. Will make the changes accordingly.
Get Started with building your own Couchbase Exporter
Time Saver Tip: You, can skip this section if OOB CB-Exporter works fine for you.Couchbase exporter written by totvslabs does provide us with a unique client that scraps 4 ReST endpoints namely /pools/default, /pools/default/tasks, /pools/default/buckets, /pools/nodes. We can run this exporter with the following command.
./couchbase-exporter --couchbase.username Admin --couchbase.password pass --web.listen-address=":9420" --couchbase.url="http://52.38.11.73:8091"Now, it is important to understand that a couchbase-exporter process binds itself to the listening port and listens to a given Couchbase server for stats . The OOB implementation does scrape data from above mentioned REST endpoints only.
In order to run this couchbase process either we can use nohup so that this process can run for an elongated period of time or create a service that accepts parameters as command line arguments.
Both, approaches will work fine for this but we have opted for an process based nohup approach to keep things simple with respect to removal of a target from monitoring task.
With respect to your use-case you might want to add new metrics for observations with different endpoints for monitoring. We will specify a simple procedure for you to add such a new metric to this couchbase-exporter tool and build your own new variant.
But, limitations with respect to monitoring N1QL queries, active requests etc. still exists. So, we will be discussing a methodology on adding new rest endpoints for monitoring in this section. Please, follow along with the steps mentioned below.
Step 1: Find the rest point that you want to get stats from and make a query via web-browser or postman with proper credentials. Let’s we picked up /indexStatus endpoint. Now, copy the response into a JSON to GoLang struct convertor and you will get your struct in which you will temporarily store your JSON response.
type Index struct {
    Indexes struct {
        StorageMode string   `json:"storageMode"`
        Partitioned bool     `json:"partitioned"`
        InstID      uint64    `json:"instId"`
        Hosts       []string `json:"hosts"`
        Progress    int      `json:"progress"`
        Definition  string   `json:"definition"`
        Status      string   `json:"status"`
        Bucket      string   `json:"bucket"`
        Indx       string   `json:"index"`
        ID          uint64    `json:"id"`
    } `json:"indexes"`
    Version  int           `json:"version"`
    Warnings []interface{} `json:"warnings"`
Remember: Prometheus only stores float64 values or bool values. Hence, it’s better to convert uint64 before feeding them into Prometheus via the collector objects.
Step 2: Now, create a index.go file where we will put this struct(just copy paste). Based on your response or ReST endpoint if it is a single response having an array of responses copy the constructor initialization from cluster.go or tasks.go respectively. Ours is an array of responses here for indexStatus involving multiple indexes stats if multiple indexes are declared. Hence, we copy the style of tasks.go initialization style. But, I’ll recommend you try something with a simpler structure similar to cluster.go client ReST endpoint.
func (c Client) Indexes() ([]Index, error) {
              var index []Index
              err := c.get("/indexStatus", &index)
              return index, errors.Wrap(err, "failed to get cluster")
Now, for our case we will be using tasks.go client file as our reference to create our metrics to observe. If you have used struct similar clusters.go file then use that as reference.
Step 3: Next, we will create a collector object that takes values stored in the client struct object and stores the metrics in which we are interested in into the Prometheus datastore. Now, create index.go in the collector directory that will perform the above mentioned task.
// string data-types are commented as Prometheus won't be able to do use them.
type indexCollector struct {
    mutex  sync.Mutex
    client client.Client
up             *prometheus.Desc
    scrapeDuration *prometheus.Desc
indexesStorageMode *prometheus.Desc
    indexesPartioned *prometheus.Desc
    indexesInstID *prometheus.Desc
    // indexesHosts *prometheus.Desc
    indexesProgress *prometheus.Desc
    // indexesDefinition *prometheus.Desc
    indexesStatus *prometheus.Desc
    // indexesBucket *prometheus.Desc
    // indexesIndx *prometheus.Desc
    indexesID *prometheus.Desc
indexVersion *prometheus.Desc
   //  indexWarnings *prometheus.Desc
}
We will then create a NewIndexCollector function that will define our newly created metrics that we are interested in, see below.
func NewIndexCollector(client client.Client) prometheus.Collector {
const subsystem = "index"
    // nolint: lll
    return &indexCollector{
        client: client,
        up: prometheus.NewDesc(
            prometheus.BuildFQName(namespace, subsystem, "up"),
            "Couchbase cluster API is responding",
            nil,
            nil,
        ),
        scrapeDuration: prometheus.NewDesc(
            prometheus.BuildFQName(namespace, subsystem, "scrape_duration_seconds"),
            "Scrape duration in seconds",
            nil,
            nil,
        ),
        indexesStorageMode: prometheus.NewDesc(
            prometheus.BuildFQName(namespace, subsystem, "indexes_storage_mode"),
            "Mode of Index Storage",
            nil,
            nil,
        ),
        indexesPartioned: prometheus.NewDesc(
            prometheus.BuildFQName(namespace, subsystem, "indexes_partioned"),
            "Partitioned Indexes",
            nil,
            nil,
        ),
        indexesInstID: prometheus.NewDesc(
            prometheus.BuildFQName(namespace, subsystem, "indexes_inst_id"),
            "Inst Id of Index",
            nil,
            nil,
        ),
...
    }
}
Then a channel object that will parse the stored data into Prometheus datastore.
func (c *indexCollector) Describe(ch chan<- *prometheus.Desc) {
    ch <- c.up
    ch <- c.scrapeDuration
ch <- c.indexesStorageMode
    ch <- c.indexesPartioned
    ch <- c.indexesInstID
    // ch <- c.indexesHosts
    ch <- c.indexesProgress
    // ch <- c.indexesDefinition
    ch <- c.indexesStatus
    // ch <- c.indexesBucket
    // ch <- c.indexesIndx
    ch <- c.indexesID
    ch <- c.indexVersion
    // ch <- c.indexWarnings
}
Then with the Collect function like in tasks.go we insert the metrics into Prometheus with bool or float64 type. Remember, to write the loop as written in tasks.go file.
indexes, err := c.client.Indexes()
// sample code inside loop
...
ch <- prometheus.MustNewConstMetric(c.up, prometheus.GaugeValue, 1)
    ch <- prometheus.MustNewConstMetric(c.scrapeDuration, prometheus.GaugeValue, time.Since(start).Seconds())
ch <- prometheus.MustNewConstMetric(c.indexesStorageMode, prometheus.GaugeValue, fromBool(index.Indexes.StorageMode == "plasma"))
    ch <- prometheus.MustNewConstMetric(c.indexesPartioned, prometheus.GaugeValue, fromBool(index.Indexes.Partitioned))
    ch <- prometheus.MustNewConstMetric(c.indexesInstID, prometheus.GaugeValue, float64(index.Indexes.InstID))
...
// sample code outside loop
Step 4: Now, the main.go client file needs to be altered and addition regarding index metric is needed to be made so that it can be collected and put into Prometheus.
...
    nodes   = app.Flag("collectors.nodes", "Wether to collect nodes metrics").Default("true").Bool()
    cluster = app.Flag("collectors.cluster", "Wether to collect      cluster metrics").Default("true").Bool()
    index = app.Flag("collectors.index", "Wether to collect index metrics").Default("true").Bool()
)
...
index object is needed to be added in the var definition section as shown above and in the main section shown below.
if *cluster {
  prometheus.MustRegister(collector.NewClusterCollector(client))
 }
 if *index {
        prometheus.MustRegister(collector.NewIndexCollector(client))
    }
Step 5: Now you need to build the MakeFile for building your own variant of couchbase-exporter. But, before that install the pre-requisites with the following command
make setupbuild: grafana
go build
.PHONY: buildAfter that run the following three commands as mentioned in the guide.
# test if all dependencies are properly installed
make test
# Build the couchbase-exporter
make build
# For finalization running linters
make ci
Now, we are finished building our own variant of couchbase-exporter. That might have been optional for many developers and users. But, discussing it is quite important for our reference guide. We can now move onto an automated approach to orchestrate communication between all these tools that are in place working perfectly fine individually.
Salability & Total Fallback Recovery: An Automated Solution Approach
Till now we have discussed how to maximize capabilities of each tool with respect to this integration project. Now, we will try to orchestrate these tools to serve the bigger picture.
A satisfactory solution: The solution must start or stop the Couchbase VMs that are being monitored based on single commands only. There shouldn’t be any need to manually add, remove or maintain the targets.json and configuration files for starter.
We want to utilize capabilities of our own network where multiple VMs can communicate. Hence, we can have a HTTP server based ReST API with which we can make these target entries appear and disappear at our disposal with ReST curl commands.
Hence, the below mentioned diagram does explain an HTTP server approach that we will be running side by side again as a service in our main VM that will automatically start and stop CB-Exporter and Prometheus processes plus maintain targets.json files also.
Basically, we also add a targets.json file for couchbase exporter tool which keeps a track of all the couchbase VMs added or removed for monitoring purposes.
The flow diagram would have clearly explained that the HTTP server add/removes entries from targets.json file for both couchbase-exporter and Prometheus. The utility functions starts and stops the couchbase-exporter processes based on that only. Hence, the complete tool works in an orchestration with this given functionality. For code, refer to this repository section.
For a full recovery system recovery let’s say after all the processes are shut down which is common for VMs getting rebooted all the time. We just need a series of commands that are needed to be executed as we have the record of targets that we want to monitor. That too only for couchbase-exporter the command is needed to be executed again & again as for Prometheus it is a one time effort only.
Total Recovery Script Procedures:

1. Start Grafana, Prometheus, Node Exporter and AlertManager Server.

2. Iterative over targets.json of couchbase-exporter and start processes by utiltiy scripts written for HTTP-Server.
Hence, the complete restoration can be done only with this two step procedure script that can be written simply in python. Keep this script as your homework and can make PR for me 😉. Please, try to use subprocess.Popen() if using them in python.
Author Experience: I have used python for developing the given server and utility functions scripts. But, while developing the couchbase-exporter tool I did realize that Golang based deployment of web-servers is a much better solution.Comment of High Availability
Prometheus runs as a standalone instance on a given VM. Now, that does create a problem if our Prometheus VM goes down, our backend data will be lost for that given period. It is a huge problem if our primary monitoring tool is Prometheus based only on running a single instance for monitoring. Hence, we will need a high availability based solution to mitigate this issue. But, we would also want that our HTTP server based automation architecture doesn't go to waste and gets integrated with ease.
What that solution will look like? We definitely have to run identical Prometheus servers(let’s say two, at minimum) to achieve this and data has to be posted to them both. Hence, separate couchbase-exporter processes for each of them with list of targets being the global one for consistency. Therefore, we will have a VIP (or user sending duplicate POST requests) that will POST and DELETE data from both the targets at the same time maintain a global list also for consistency of our solution. The HTTP server will be running on both the VMs to whom the POST/DELETE request will be communicated via a VIP. Also, another HTTP server on each of the VM will be maintaining the consistency of the targets.json file by sample gossip protocol. Finally, two AlertManagers connected by mesh will be receiving the data metrics from any of the Prometheus datasource to raise alerts which will then be deduplicated and sent across multiple communication channels. Below, is the abstract diagram representation of the solution.
Now, alerts that will be raised will be sent to each of AlertManagers running in the Mesh Clusters in this architecture.
AlertManager’s deduplication concept will help us to send proper alerts via proper medium to the designated users. This is a good monitoring solution with lots of metrics being available for monitoring. But, again for business critical applications such monitoring solutions, even the highly available solution that we have discussed needs to be tested robustly. Happy monitoring and alerting to you !!
Conclusion
With this article we have tried discussing almost all the important parameters related to these tools. In summary we have discussed building dashboards for Grafana, Prometheus monitoring and alerting analysis with its multiple tools. creating a custom couchbase-exporter tool, writing automated solutions, full blown recovery homework and discussion about high availability of these systems and possible solutions. Hope, you would have learnt new things about these tools and would create your own scalable monitoring solutions. Plus, would be kind and considerate to share it with us.
In case of a missing issue that we have failed to address or interpret, do either drop an issue or write a response, would appreciate your time in improving this article.
There is still scope of improvement in the current solution like consistency with HA solutions, de-duplication of alert demonstrations, syncing multiple AlertManagers etc. Would really appreciate it if you can share your findings with others as well.
BTW, wouldn't it be nice if we can do predictive analytics as well on this monitored data.
My work here is done. This is the way.