
Photo by energepic.com from Pexels
TL;DR: Generally used technical indicator events do NOT appear to be good predictors of above average, or negative, returns for cryptocurrencies when utilizing daily prices and when used alone. In addition, in markets that have moved primarily upward, it is probably unwise to put too much faith in indicators that predict upside performance.
Our Hypothesis
The hypothesis is that technical indicators are untested in this market, and as a result, analysts and traders may or may not be applying them properly. We set out to find out whether or not certain technical indicators have any value in predicting any upside or downside performance.
Our Process
- We define a set of cryptocurrencies to analyze, using market cap and amount of available data as our filtering criteria.
- We define a set of technical indicator events to test. Note that these indicators are not meant to be representative of all technical indicators, but rather a worthy, and frequently used few with which to illustrate our analysis. (Note: If you have additional indicators you’d like to see in this analysis, please let us know in the comments below).
- We define what “predictive value” means for this exercise and analyze the returns after various events utilizing this criteria.
1. Defining the Cryptocurrencies To Analyze
First we define which currencies we want to look at. We can start by looking at the market cap of each coin on Coin Market Cap. For this exercise, we haven chosen the top 20 coins by market cap and removed any coin that doesn’t have more than 2 years of daily data. This leaves us with the following coins to analyze.
- Bitcoin (BTC)
- Ethereum (ETH)
- Ripple (XRP)
- Litecoin (LTC)
- Dash (DASH)
- VeChain (VEN)
- Monero (XMR)
It is worth noting that many of the more popular coins such as Bitcoin Cash (BCH), Cardano (ADA), Neo (NEO), etc. have less than 2 years of data. As a result they are currently removed from this analysis.
Why do you need two years of data? Two years of data represents approximately 730 data points, since crypto trades every date at all times. Some of our indicators, like simple moving average over 200 periods, require at least that many periods to be relevant. This gets even more complicated when you begin bootstrapping exponential averages for other indicators like RSI and Stochastics. Therefore, having a good set of data to begin with that will cover the priming period of many indicators is essential.
2. Defining the Technical Indicator Events
Probably the most important aspect of this research is choosing which technical indicator events to analyze. To start this research, we chose a handful of commonly used technical indicator events and evaluated both the cross above and cross below events to try to capture directionality.
For example, “RSI below 30” is often cited as a “oversold” indicator, indicating that the price should rise from that point forward. To capture this event, we use both entering that condition rsi(14) crosses below 30 and exiting that condition rsi(14) crosses above 30.
Why choose the value inputs of
**14**for RSI, or**12,26,9**for MACD? Many of the technical indicators are traditionally utilized with “default” values. We have noticed that traders are tending to use these default values in analyzing cryptocurrencies as well. Though Gatsiva does this analysis internally via our genetic algorithms, “tuning” these parameters for a particular currency is beyond the scope of this article.
In addition, we will also divide our events into two categories for analysis purposes: downside and upside events. Downside events will be those that typically predict an overbought condition and are supposed to predict future lower prices. Upside events will be those that typically predict oversold conditions and should be indicators of future higher prices.
3. Defining “Predictive Value”
For our analysis, we will define the “score” of a technical indicator event by how well it performs on average after an event occurs. Events that are supposed to predict upside performance should produce returns above the average return. Events that are supposed to predict downside results should see a negative, or at worst, a neutral return.
Therefore, we will use the following approach to “score” our events:
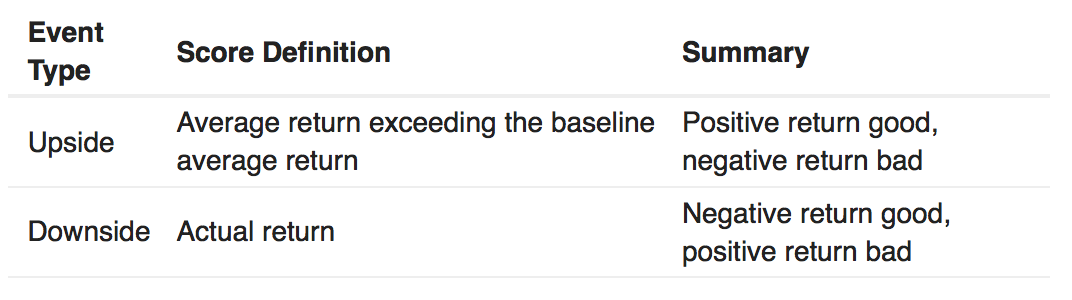
Table 1. Event Type and Score Definitions
Note: We recognize analysis could certainly be repeated using various criteria for “predictive value”. If you have ideas, please leave them in the comments below.
Finally, since we don’t really know what periods are worth looking at, we’ll compare returns at the 1, 7, 14, and 28 day intervals after an event occurs.
The Analysis
We’ve written this analysis in Python script, but it could be done in any language by utilizing the Gatsiva API to retrieve market data and retrieve the list of dates for which a particular event is true.
For more information please see the Condition History and Symbol Price Data transactions of our API documentation.
Looking at Occurrences
The first thing we want to do is check out how often these events actually occur during our test period. Since we selected our coins by the criteria of who had at least 2 years of data, we selected 01–01–2016 through 02–11–2018 as our period of analysis. We can then easily check how often these events occurred for each coin.
The following charts below shows a heat map of occurrences by coin and by event, separated by downside and upside events.
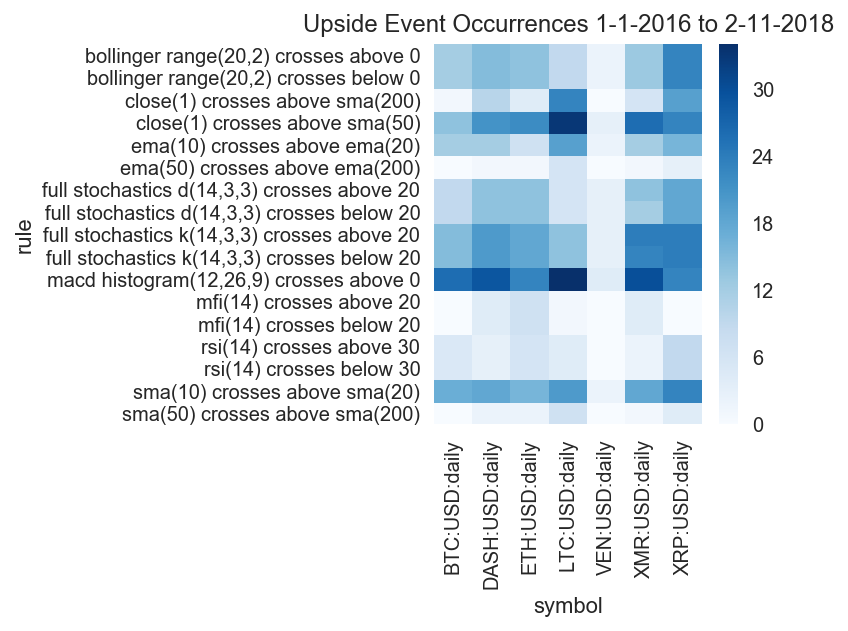
Figure 1. Upside Event Occurrences
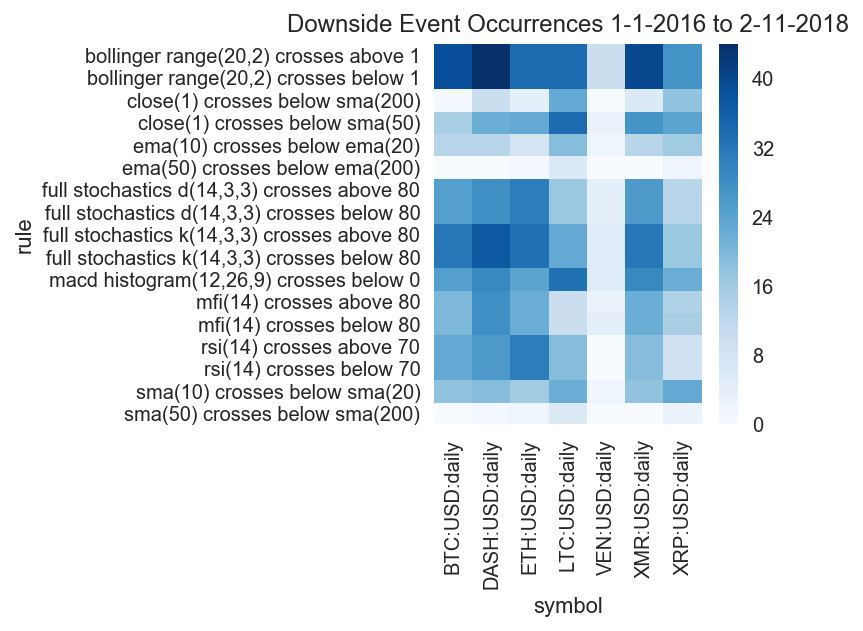
Figure 2. Downside Event Occurrences
Observations:
- The SMA and EMA 50/200 crossover events happened very rarely for all coins. These events are probably not useful to predict performance since they happen infrequently.
- VeChain (VEN) had very few technical indicator events occur in general. Therefore, we will remove it from our analysis moving forward.
- In general, events that occur when prices are high tend to occur more often (e.g. bollinger range breaching 1, full stochastics crossing above or below 80, rsi crossing above and below 70, and mfi crossing above and below 80). This is not surprising since cryptocurrencies in general have been increasing rapidly over the past 2 years.
Looking at Baseline Returns
Next we calculate the average return after 1, 7, 14, and 28 days. For this exercise, we are simply averaging the returns observed after every period. Here we can see that every coin within our scope of analysis has gone up.
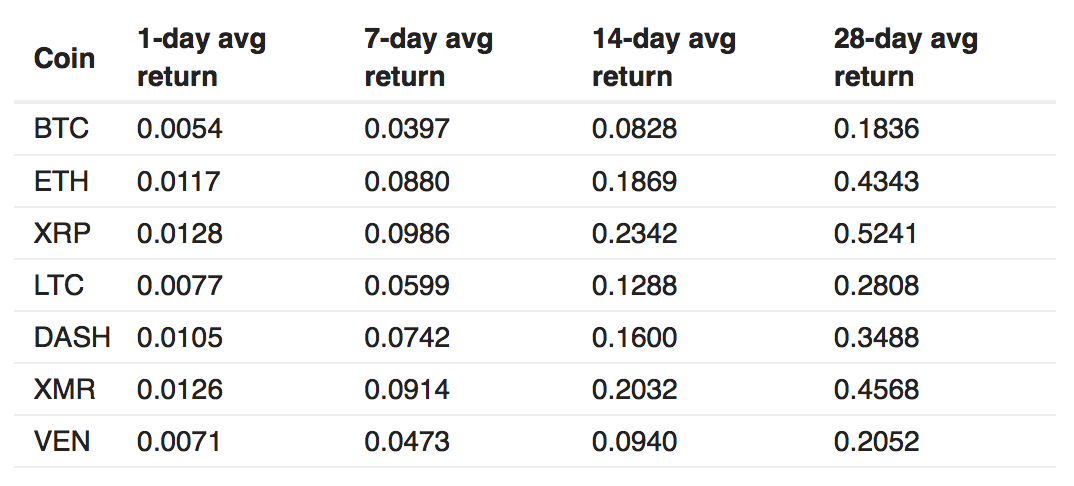
Table 2. Average Returns For 1, 7, 14, and 28-day Periods
This table is an important set of facts to keep in mind as we analyze post-event returns. Many upside technical indicators will appear to work simply because the entire trend of prices is upward.
However, we can adjust for this as mentioned above by defining “predictability” for upside events as the extent to which they exceed the average return that is otherwise observed.
Calculating and Visualizing “Predictive Value”
Now comes the main core of our analysis.
To start we will look at the return the period immediately after the event occurs, in this case, 1 period afterwards.
In the case of upside events, green cells indicate areas of stronger than average performance, red cells indicate areas of weaker than average performance.
In the case of downside events, as indicated before, green cells indicate areas of negative performance (what we would want to see from a downside event), and red indicates areas of positive performance (what we would want to avoid with a good downside event).
So remember, in both cases here, green is good!
Areas in grey represent areas with no results because there were no events observed and thus, no score available.
Upside Event Observations:
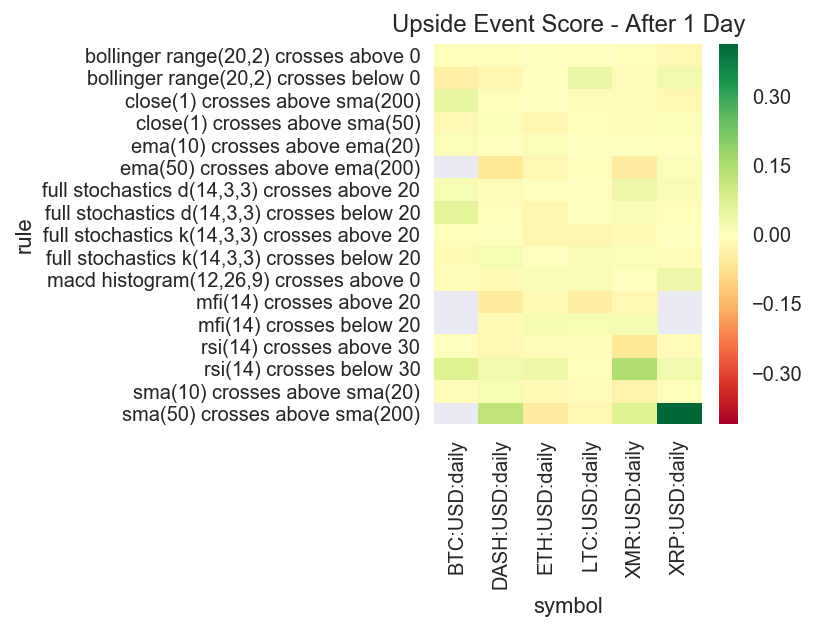
Figure 3. Upside Event Returns - 1 Day After Event
- For upside events we see very inconsistent performance. With the exception of potentially
rsi(14) crosses below 30, which only showed negative performance for DASH. There are no events which consistently show better than average positive performance for multiple coins. full stochastics d crosses below 20andrsi(14) crosses below 30show interesting potential performance for BTC on a daily basis. However, both of these events occurred quite infrequently (12 times and 4 times respectively) over the last 2 years.sma(50) crosses above sma(200)show interesting potential performance for DASH, XMR, and XRP on a daily basis. However, this events occurred less than 5 times over the last 2 years. For LTC, this event occurred 7 times but the performance is not above average.- In addition, we see quite a bit of negative performance as well spread throughout other currencies, indicating that these events don’t seem to predict any general results.
Downside Event Observations:
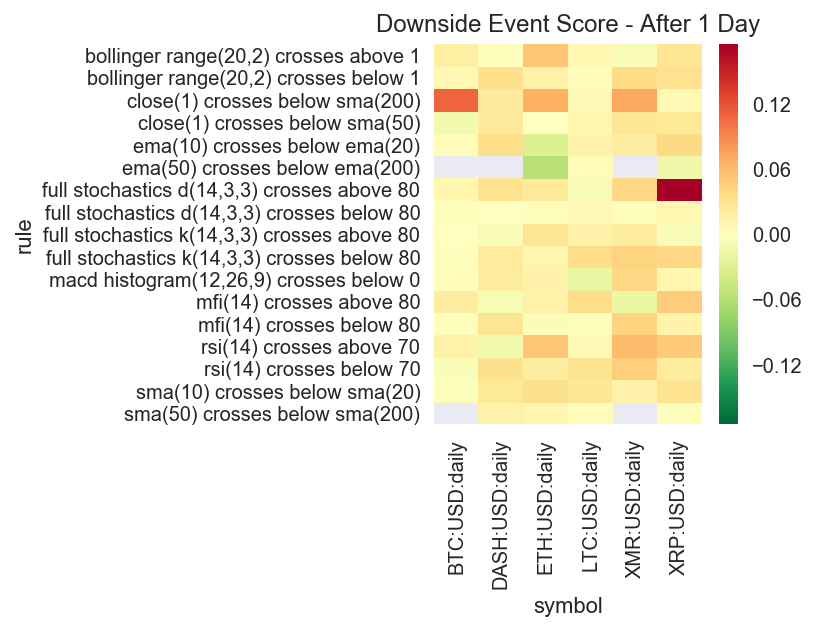
Figure 4. Downside Event Returns — 1 Day After Event
- Overall, we see very little good performance (Remember: in this case, good performance would be a negative return). This is likely because of the huge run up in value during the 2017–2018 time period.
- ema crossovers appear to have some value for ETH. However with only 7 observations of the ema 10/20 crossover and only 1 observation of the ema 50/200 crossover, we wouldn’t put much weight behind it at the moment.
- There are some other very small pockets of good performance, but overall we see inconsistency between coins like we observed in the upside event results.
Now what we can do is look at other periods. The following images show the upside and downside event performance for 7, 14, and 28 days after the events.
7 Days After Event
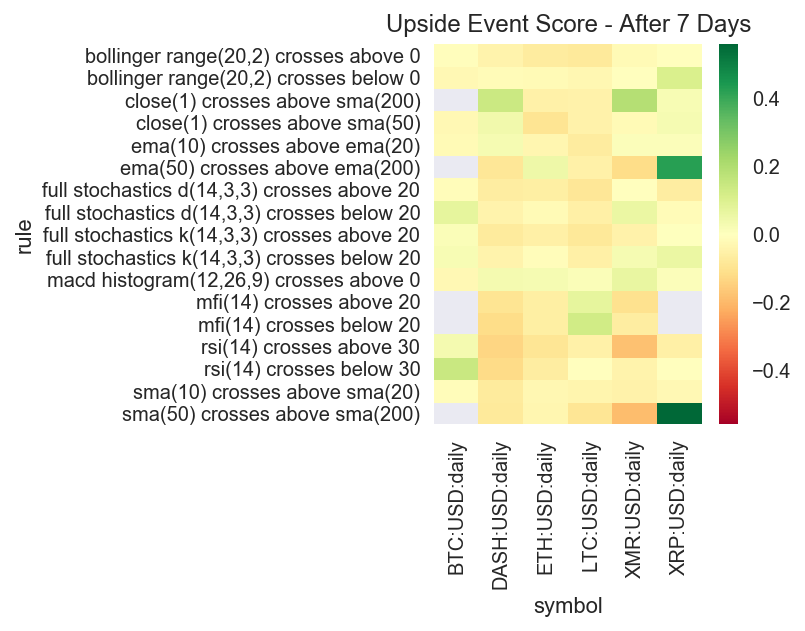
Figure 5. Upside Event Returns — 7 Days After Event
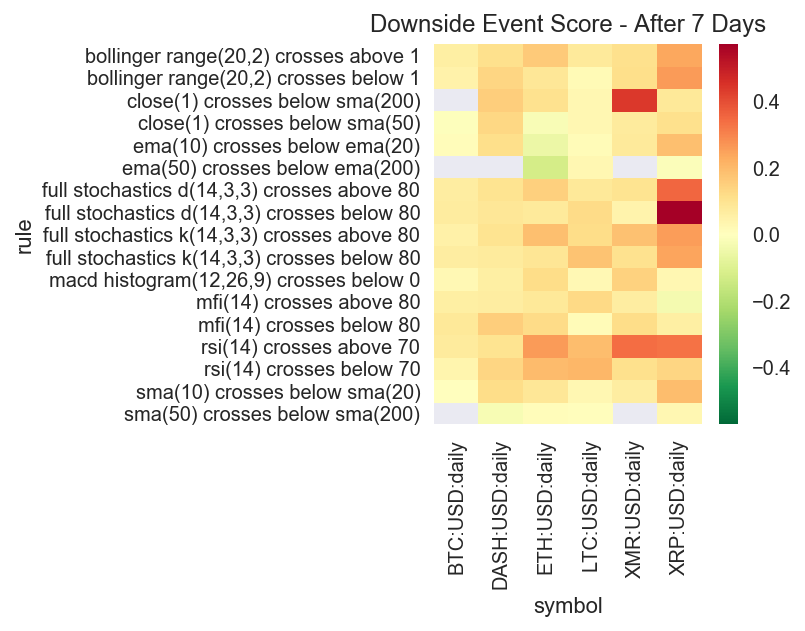
Figure 6. Downside Event Returns — 7 Days After Event
14 Days After Event
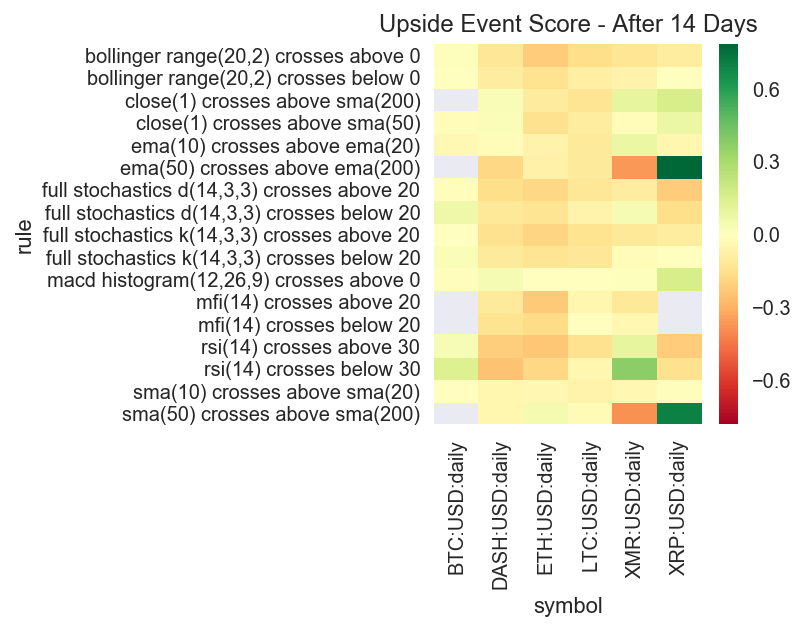
Figure 7. Upside Event Returns — 14 Days After Event
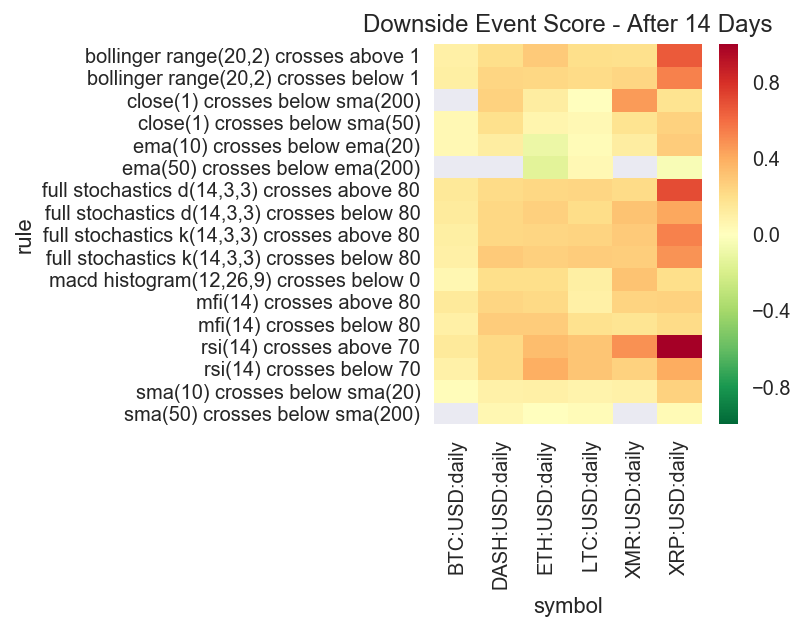
Figure 8. Downside Event Returns — 14 Days After Event
28 Days After Event
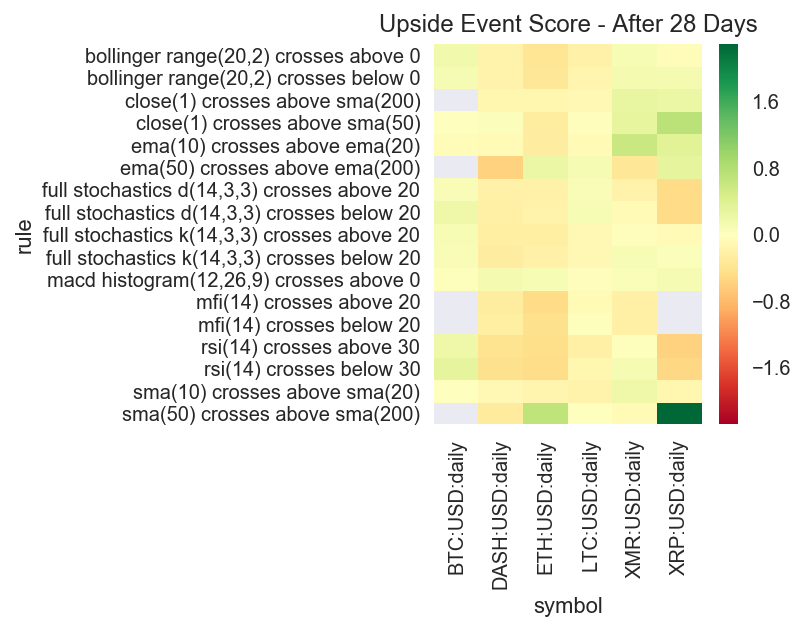
Figure 9. Upside Event Returns — 28 Days After Event
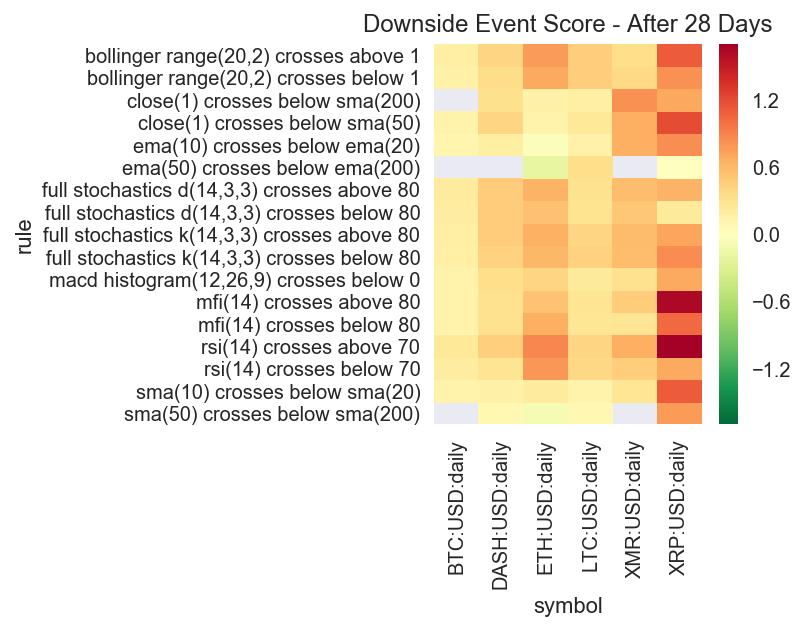
Figure 10. Downside Event Returns — 28 Days After Event
In general we see the exact same pattern with one exception that could be explored further. BTC seems to show relatively good performance with upside events, but only after 28 days. We suspect that this is because of the strong upward momentum of BTC prices over the history of the analysis period and has little to do with the specific indicator event in question.
Conclusions
Based on daily data over the last two years, it does not appear that the technical indicator events we have chosen for this analysis have strong predictive value for finding above average or negative returns when utilized on daily data in a standalone fashion.
Future Analysis
Though these indicators may not appear to work, we don’t think this is necessarily the end of the road. Some potential paths for follow-up research include:
- Expanding the set of indicators: We know we only chose a small subset of indicators. There may vbe others out there that work much better for cryptocurrencies.
- Looking at combinatorial aspects of indicators: Indicator events are often used to support a thesis, not used alone. Looking at combinations of signals may be fruitful.
- Tuning indicator time periods: We know from experience that standard time periods for technical indicators used in equities require tweaking when used for cryptocurrencies. Our genetic algorithm research has proven this. Exploring which parameters work best would be a worth exercise.
- Looking at how these returns change over time: This is what Gatsiva does already with our confidence band shift analysis. By looking at the trends of indicators over time, we have the ability to see if technical indicator is trending as a better or worse indicator.
- Applying a different definition of “predictability”: There is more than one way to look at predictability. Options could include using median instead of average, looking for a minimum or maximum threshold of returns, etc.
- Changing the timescale of analysis: It is possible that trends for daily data may be too volatile, but trends for hourly might yield results. We are working on this analysis now and will publish Part 2 shortly.
About Gatsiva
At Gatsiva, we provide APIs and tools empowering analysts to do similar research to what’s been presented above. We also provide research and education articles that help traders and analysts determine the viability of technical signals.
In addition, Gatsiva uses machine learning and genetic algorithms to find the technical indicator events that actually work, and track their performance over time. We believe this is a strong differentiator when compared to using common indicators such as those provided in this analysis.
To learn more, you can visit us at https://gatsiva.com or at https://twitter.com/gatsiva.
Finally, if you like what you just read: Feel free to bookmark this article, clap, or leave a comment! It helps us help more people!
[story continues]
tags