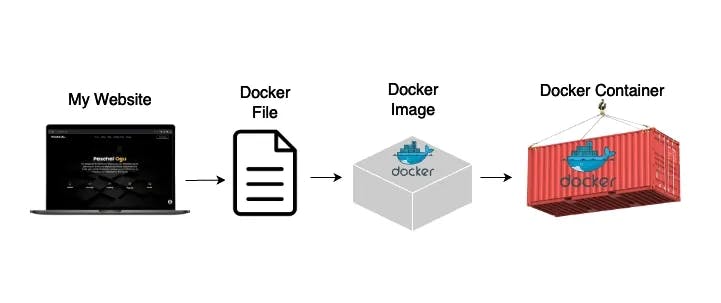
Docker is fast until it is slow. As application growth in containers expands, image size and initial start time become sneaky performance bottlenecks. Here, in this post, I'll detail advanced-level Docker image optimization strategies that helped me reduce production images from nearly one gigabyte to under 200MB without loss of functionality.
We'll leave multi-stage builds and Alpine images behind and cover debugging, benchmarking, and hard-earned, real-world experience learning from deployments.
Why Optimize Docker Images?
Docker image optimization is not just about saving space. Optimized images:
- Speed up deployments: Smaller images download, pull, and deploy faster, keeping CI/CD pipelines fast.
- Conserving resource usage: Minimizing image sizes helps limit storage needs and bandwidth costs.
- Reduce surface area: Lower image surface area means fewer vulnerabilities.
Advanced Techniques for Docker Optimization
1. Multi-Stage Builds Aren’t Optional
Docker supports multi-stage builds, which can by and of itself reduce image sizes by ensuring only runtime essentials are inlcuded in the final image.
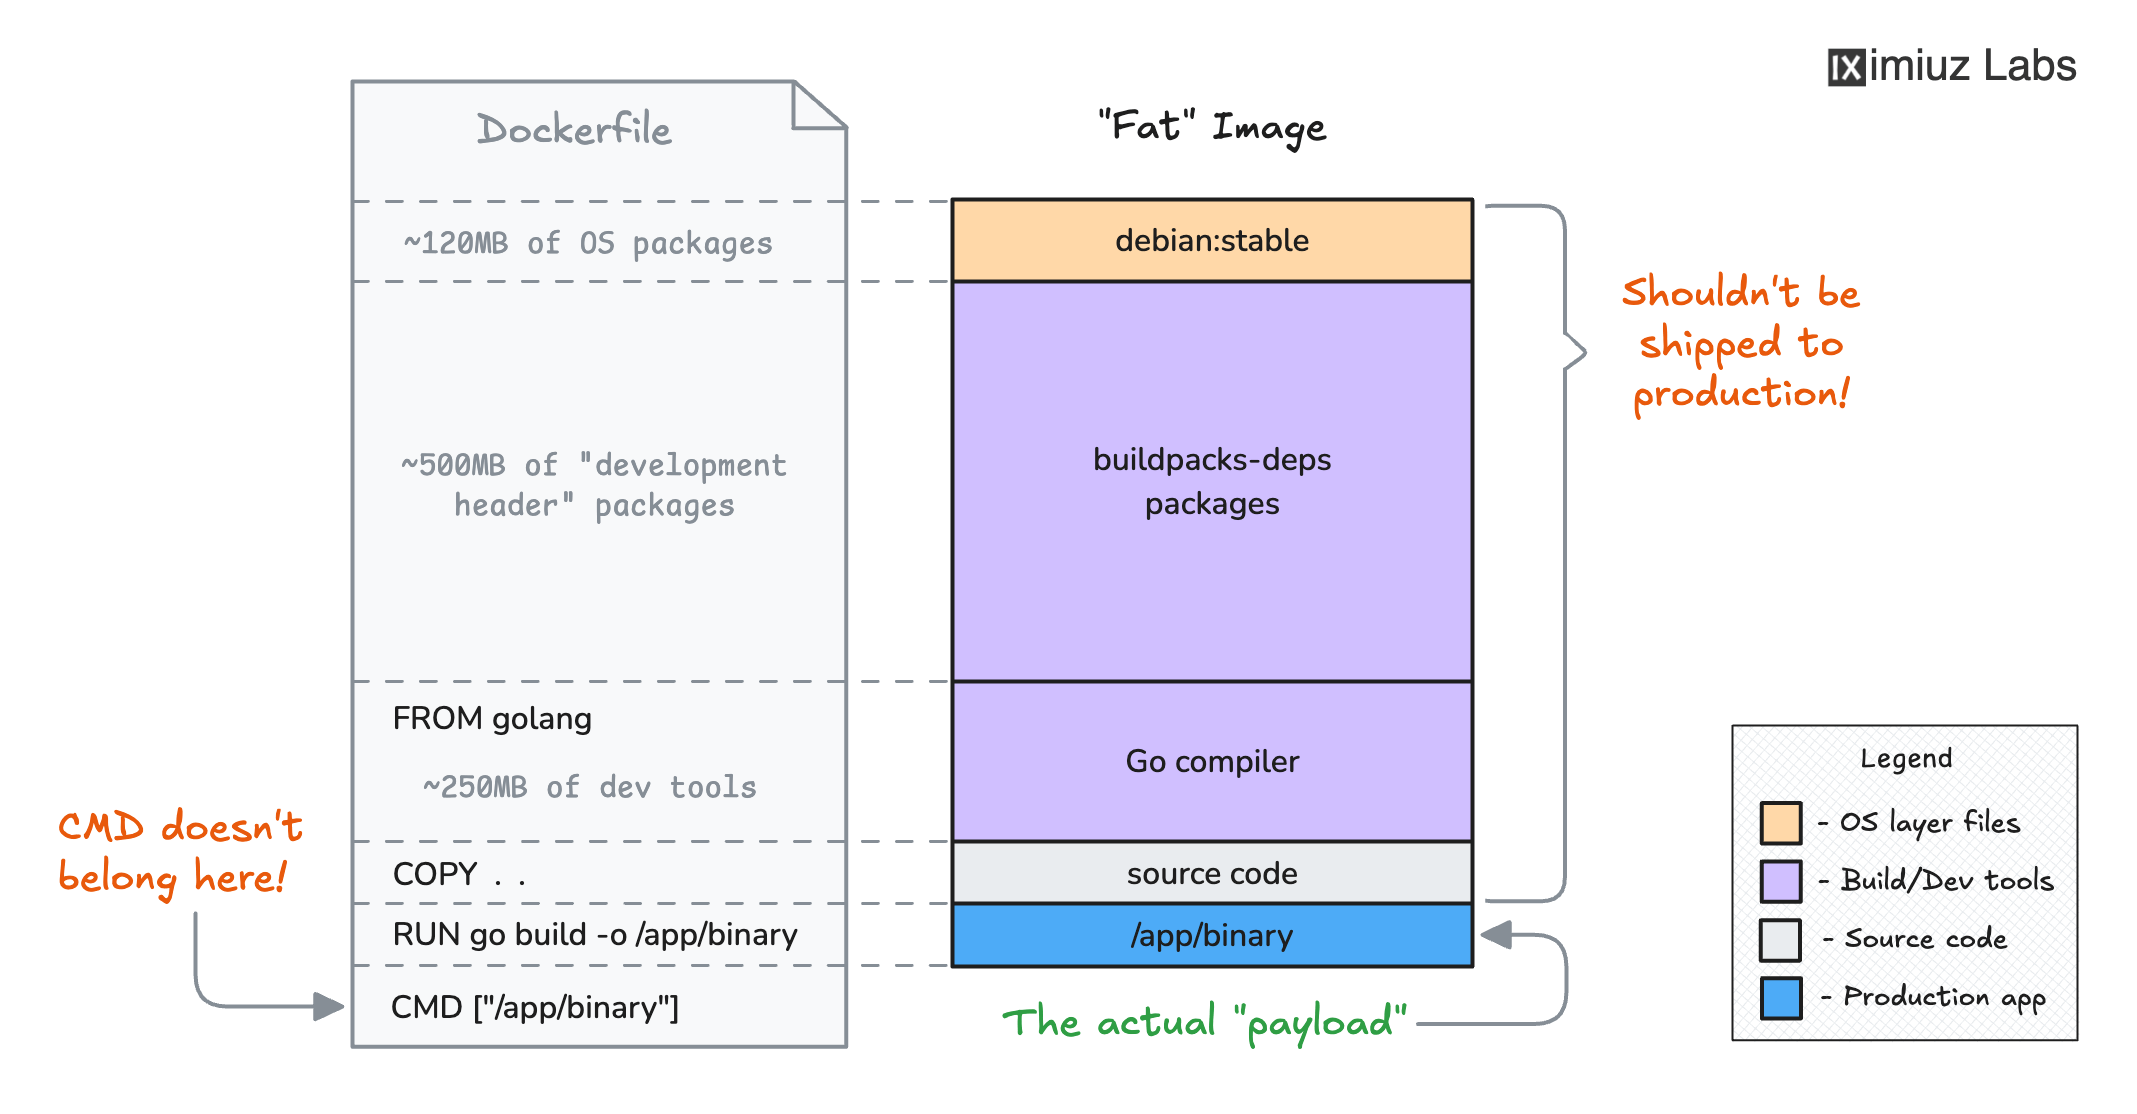
Before optimization:
FROM node:18
WORKDIR /app
COPY . .
RUN npm install
RUN npm run build
CMD ["node", "dist/index.js"]
After optimization (multi-stage build):
# Stage 1: Building
FROM node:18 AS builder
WORKDIR /app
COPY package*.json ./
RUN npm ci
COPY . .
RUN npm run build

# Stage 2: Production
FROM node:18-alpine
WORKDIR /app
COPY --from=builder /app/dist ./dist
COPY --from=builder /app/node_modules ./node_modules
CMD ["node", "dist/index.js"]
Result: Reduced image size from ~900MB to ~160MB.
2. Minimizing Layers
Each Dockerfile instruction creates a layer. Excessive layers increase build times and image size. Group commands logically:
RUN apt-get update && apt-get install -y --no-install-recommends \
    curl \
    libjemalloc2 \
    libvips42 && \
    rm -rf /var/lib/apt/lists/* /var/cache/apt/archives/*
3. Using Minimal Base Images
Always select the smallest viable base image:
- Alpine Linux: Great for minimal applications (e.g., microservices).
- Debian Slim: Ideal balance between minimal size and compatibility.
Example:
FROM ruby:3.4.1-slim
Compare base images:
ruby:3.4.1-bookworm – 1.01GB
ruby:3.4.1-slim – 219MB
ruby:3.4.1-alpine – 99.1MB
Your base image is significantly responsible for performance, compatibility, and the security posture.
|
Base Image |
Size |
Security |
Compatibility |
|---|---|---|---|
|
|
~20MB |
High |
Some glibc issues |
|
|
~60MB |
Medium |
Good for most apps |
|
|
~40MB |
High |
Best for production |
- ✅ For apps with native deps: prefer node:18-slim
- ✅ For minimal attack surface: gcr.io/distroless/nodejs
4. Use .dockerignore Aggressively
Even seasoned developers often forget to do it. Here’s a basic .dockerignore:
.git/
node_modules/
.env
log/
tmp/
*.log
This prevents us from accidentally including sensitive or unnecessary files and helps further shrink the image. Anything not needed at runtime should very simply, be ignored.
5. Clean Up After Yourself
Inside the build stage, clear temporary files:
RUN npm ci && npm cache clean --force && rm -rf /tmp/*
This prevents bloated layers and unused files from creeping in.
Dockerfile Anti-Patterns that should be Avoided!
Here are some common traps:
- ❌ Using the latest tag can break the ability to reproduce
- ❌ Installing unnecessary tools in the final image (e.g., curl, git)
- ❌ Forgetting to create a .dockerignore file
- ❌ Using ADD instead of COPY without having the intent to compress
✅ Remember to always build for purpose and not just for convenience.
AI-Powered Dockerfile Linting: A Sneak Peek
Docker’s Smart AI Agent (introduced in Docker Desktop 4.40) is changing how we write Dockerfiles. It scans your Dockerfile and provides helpful suggestions like:
- Helping remove unused build tools
- It tries to split
RUNsteps for caching - It suggests the usage of multi-stage builds
You can enable it in Docker Desktop > Settings > AI Suggestions.
Benchmarking and Validation
Try to use Dive or DockerSlim to analyze image contents:
dive myapp:latest
Or inspect your layer sizes:
docker history myapp:latest
Make sure at runtime:
time docker run --rm myapp:latest
Always track Docker startup latency, and this is especially key in serverless platforms.
Printable Cheatsheet: Docker Image 10 Commandments
- You should utilize multi-stage builds
- You should delete temporary files and cache
- You should use .dockerignore
- You should not run containers as root
- You should use healthchecks
- You should not use the latest tags
- You should pin base image versions
- You should divide RUN steps logically
- You should test image-related cold start times
- You should always be monitoring, examining, and refining
Write it out and post it on your terminal.
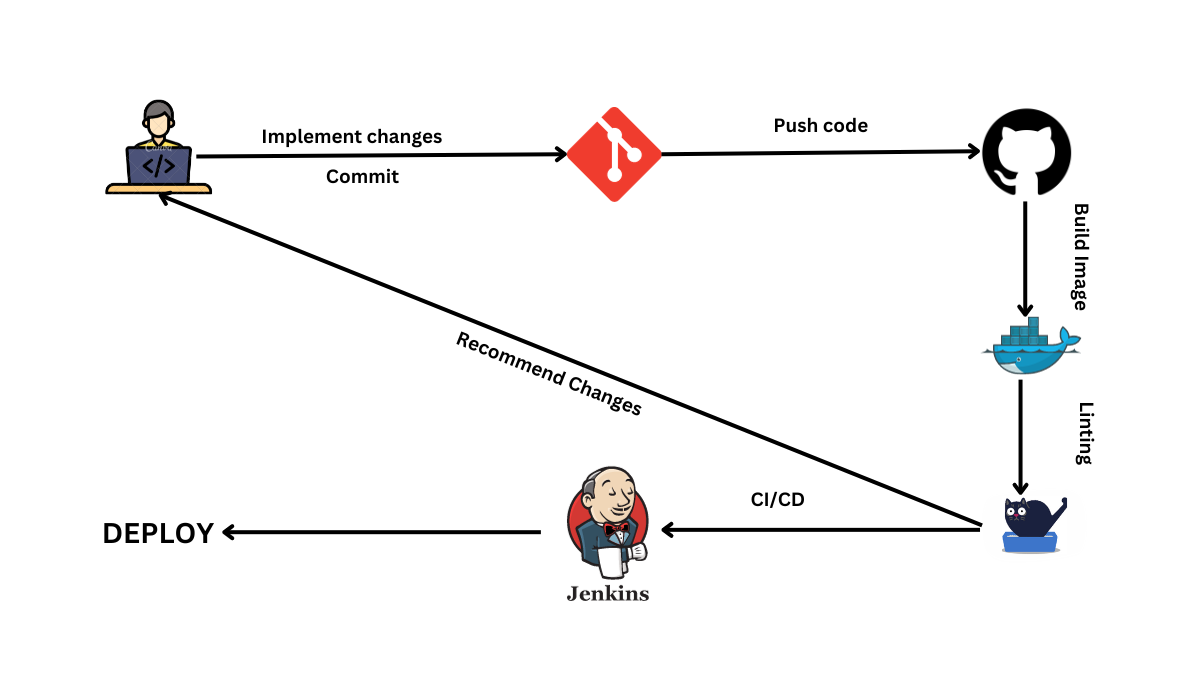
Integrating Docker Image Metrics with Observability Tools
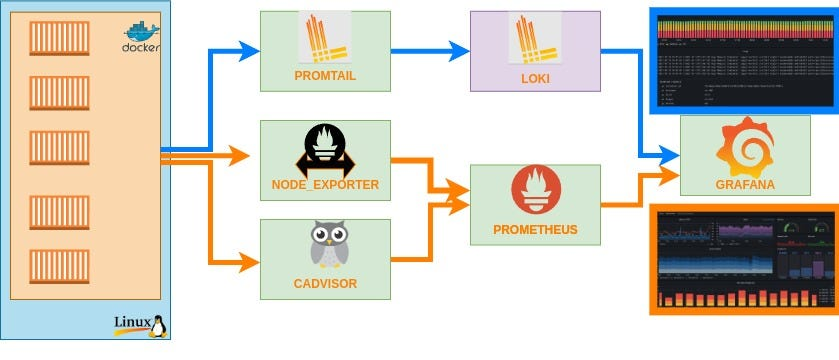
Once you've got your Docker images tuned, you'll want to make their performance visible over time. Having image size, build time, and container launch time in your CI dashboard or observability product is how you ensure you're detecting regressions.
We paired GitHub Actions with Prometheus + Grafana at the workplace to monitor build size and cold start time on each commit. That gave us a visual alert whenever somebody committed an enormous dependency or misconfigured a layer. You can get Docker layer sizes from docker inspect and plot them as trends as well.
Real-World Debugging: When Optimization Saved Us in Production
A single service was booting in over 2 minutes in one production release due to an incredibly large image and missing healthcheck. Scaling operations were timing out, and user traffic was being dropped.
We were able to achieve boot time reduction to 10 seconds by refactoring using multi-stage builds and opting to switch to node:18-slim. That one alteration brought about autoscaling again and halved error rates.
Optimization is not necessarily about beauty, occasionally, it is about uptime.
Conclusion: Build Lean and Ship Fast
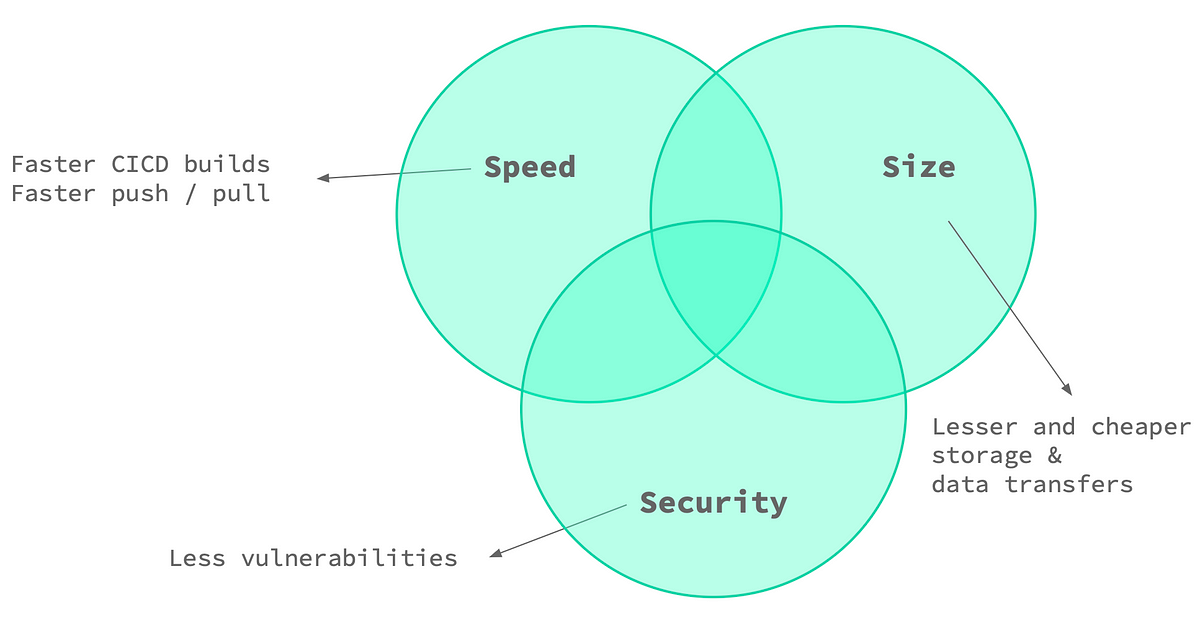
Image optimization is an undercover superpower. It boosts security, boot time, costs, and dependability. This is most often achieved without changing a line of application code.
By embracing such methods:
- We reduced image size by 80%.
- Increased CI/CD speeds
- Improved production resilience
And this was not theoretical - these were lessons gleaned on concrete infrastructure.
Happy shipping. Light, fast, secure.
[story continues]
tags