Note: XR means Extended Reality, which includes Virtual Reality (VR), Augmented Reality (AR), and Mixed Reality (MR).
The internet has rapidly transformed the way we interact with the world; XR will do the same. While the internet has been around for more than 30 years, XR is still in early stages of development. However, there is substantial consumer appetite for XR, and it’s likely to become mainstream within the next few years.
As evidence, PlayStation 5 and Quest 2 (Meta’s VR headset) came out around the same time - Q4 2020. Through Q2 2022, it’s estimated that Quest 2 sold 15 million units compared to PS5’s 22 million. This is nearly 70% sales volume of the all-time best selling gaming console brand. While not an apples to apples comparison (PlayStation had supply chain issues with PS5 resulting in demand far outstripping supply), it shows that there’s substantial appetite for VR experiences.
At a more recent checkpoint (February 2023), PS5 added 10 million more units sold, bringing its total to 32 million. Over the same period, Quest 2 sales appear to have slowed, adding only a couple million more units at best over the back half of 2022 after having averaged more than 700,000 units per month through 2Q 2022. Still, these are impressive numbers for Quest 2 given that the AAA gaming experience (incredible graphics and game complexity) has yet to be realized due to hardware constraints (XR2 processor).
Premise
There’s value in comparing adoption of the internet with that of VR because internet use and VR use are fundamentally similar. Both technologies allow users to access information and content that is not physically present in their surroundings. Additionally, both technologies can be used for a variety of purposes, including entertainment, education, and training. However, there’s an important use case that VR hasn’t cracked, which could be the key to broad adoption (more on this later).
VR is important because it is a gateway to the metaverse (which, if realized, is projected to be an economy worth up to $4 trillion by 2030). While not essential to experience the metaverse, VR’s immersive quality is a great complement.In three slides, I’ll outline my thinking about where we are in the VR lifecycle and where in the XR tech stack is the key to unlocking all this value.
Internet Phases
Average time spent online is a proxy for value accrual on the internet as well as an indicator of when and why it accrued. Because I’m focused on aggregate value, I calculated US weighted average time spent online (which accounts for the percent of the US population online). In 1995, only 14% of the population was online, so there was almost no daily usage on average. By the end of 2022, 93% of the US population was online spending over 6 hours per day on average.
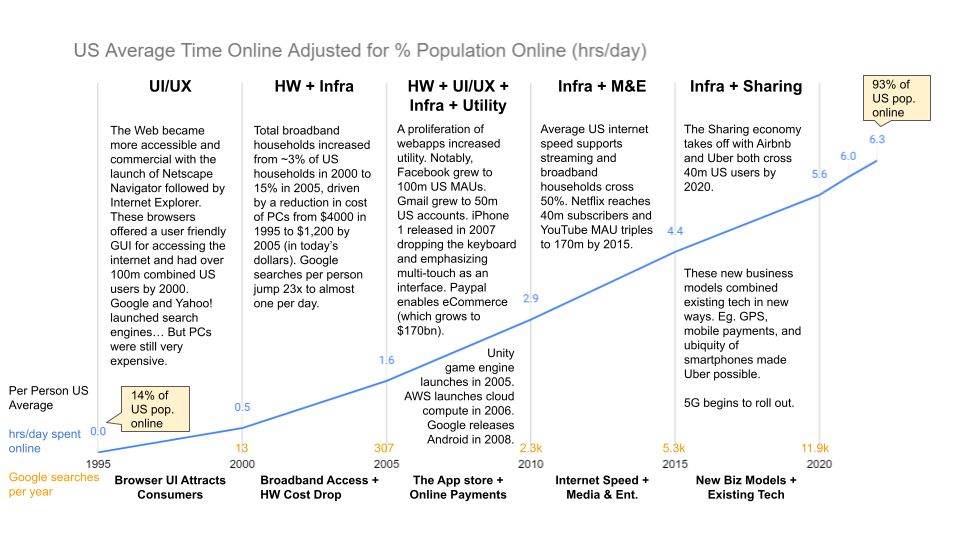
To understand usage drivers, I broke the timeline into five-year blocks, categorizing the main innovations that drove internet adoption during each period:
1995-1999 (UI/UX)
- Netscape Navigator was a breakthrough in UI/UX that enabled the general public to easily access the internet. Microsoft followed suit with Internet Explorer. Note: when a technology has a UI/UX (frontend) as well as an infrastructure (backend) component, I emphasize the UI/UX because consumer adoption is the relevant lens. These browsers offered a user-friendly GUI for accessing the internet and had gained over 100 million combined US users by 2000.
- An equally important UI/UX development was the search interface. Yahoo! And Google launched in 1995 and 1998 respectively.
- PCs (a prerequisite for regular internet use) were available, but were very expensive. The average price of a computer in 1995 was nearly $4000 in today’s dollars.
2000-2004 (HW + Infra)
- As broadband infrastructure became more widely available (15% of households had broadband by 2005, up from 3% in 2000)...
- …and PC cost dropped (to $1,200 in today’s dollars by 2005), Google searches jumped to ~ 1 search per day per person (weighted average across the entire US population).
2005-2009 (HW + UI/UX + Infra + Utility)
- iPhone launched in 2007, cementing multi-touch as the interface. This was a paradigm shift in UI/UX that increased screen real estate, transformed navigation/selection, and started the decentralization of content consumption away from fixed hardware like desktops and eventually away from TVs as well.
- Utility apps were the first to reach scale with users. Gmail grew to 200 million accounts worldwide (50 Million US). Driven by the ability to transact online with PayPal, ecommerce in the US nearly doubled over the period to $170bn. I also consider Facebook fundamentally a utility - like the phonebook, it’s a record of your contacts, but it’s dynamic. It grew to 482 million MAUs by 2010 (100 million US).
- On the infrastructure front, Unity game engine launched in 2005, advancing the game developer tech stack. It would ultimately grow to almost 50% market share vs Unreal’s 13% as of 2020. Although Unity is less popular than Unreal with AAA gaming studios, it’s preferred by many developers because it’s easy to learn (code in C# vs C++), with an intuitive interface. AWS launched elastic cloud compute in 2006, eliminating the need for internet startups to stand up their own servers. This allowed them to come to market and scale faster while reducing upfront cost. Google released Android, its open source mobile operating system in 2008. Before Android, device manufacturers had to either license a third party OS or spend the time and money building their own from the ground up. Beyond the benefit to OEMs, app developers were able to reach a broad base of Android powered devices.
2010-2014 (Infra + M&E)
- Broadband households surpassed 50% by 2014, up from 35% in 2010. Importantly, average speed and bandwidth now supported streaming.
- This allowed entertainment startups like Netflix and YouTube to scale to 40 million US subs and 170 million US users respectively by 2015.
2015-2019 (Infra + Sharing)
- 5G began to rollout in 2019, bringing higher bandwidth and lower latency connection.
- Startups like Uber, leveraging utilities such as GPS and mobile payments, took advantage of the ubiquity of smartphones to layer innovative business models on top of existing technology. By 2020, Uber and Airbnb both crossed 40 million users in the US.
VR Phases
There are only 7 years of history in VR, which is the time equivalent of about one internet period. But development cycles shorten as the pace of tech innovation increases over time. This means that products are iterated at a faster pace, improving consumer experience more quickly. Still, we’re in very early stages of VR as only 3% of the OECD population has a standalone active headset.
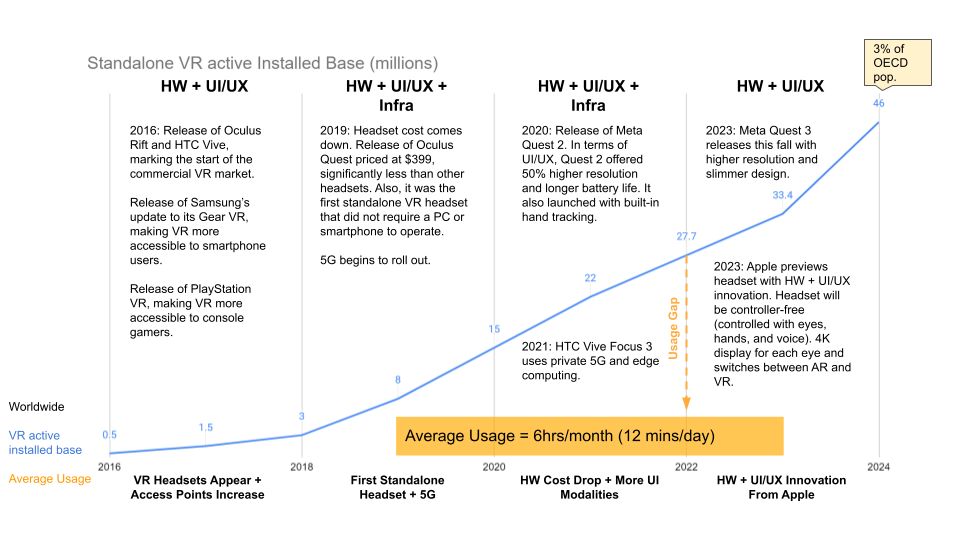
It’s worth calling out that the blue line in the above VR chart differs from the blue line in the internet chart. Although both lines go up and to the right, the internet usage line represents actual value, while the VR installed base represents potential value. More directly, VR has a usage gap (I’ll elaborate on that in the next section).
To understand drivers of VR headset ownership, I broke the timeline into two-year blocks, categorizing the main innovations that drove purchases during each period.
2016-2017 (HW + UI/UX)
- The Oculus Rift released in 2016 and was the first well known consumer VR headset. At $600, it launched at a moderate price point, but came with the inconvenience of having to be tethered to a gaming computer.
- HTC Vive released the same year at the premium end, offering a high fidelity gaming experience, but also required a powerful gaming PC to back it up.
- Accessibility increased as PlayStation VR made VR more accessible to console gamers and Samsung released an update of its Gear VR, leveraging the smartphone as the display, making VR accessible to anyone with a smartphone. While the experience wasn’t on par with tethered headsets, the $99 price point democratized VR to a wider audience.
2018-2019 (HW + UI/UX + Infra)
- Oculus Quest, released in 2019, was the first standalone VR headset that did not require a PC or smartphone to operate. This was a significant step forward in user experience. It had no cumbersome wires and simple controllers.
- On the infrastructure side, 5G began to roll out. With higher bandwidth and lower latency, 5G supported more immersive and interactive XR experiences (allowing users to stream high-quality VR content without experiencing buffering or lag).
2020-2021 (HW + UI/UX + Infra)
- The second generation of Quest offered 50% increase in pixel resolution, longer battery life and came with built-in hand tracking (whereas it had been a somewhat clunky software update for gen 1).
- HTC Vive 3 released in 2021 targeting enterprise customers, however, the feature set was highly relevant to consumer use cases. High-fidelity wireless VR is the ultimate goal to achieve mainstream adoption. VR users had to choose between physically connecting to a gaming PC for low-latency and high-fidelity, or compromise on performance for a wireless, all-in-one experience. The VIVE Focus 3 used a private 5G network to deliver low latency and high speed VR experiences. HTC used Lumen’s edge platform to maintain performance by rendering VR content locally, instead of relying on a remote server. Edge computing will be the next big infrastructure leap forward in XR.
2022-2023 (HW + UI/UX)
-
Meta Quest 3 will release in fall 2023 with higher resolution due to a next gen Snapdragon GPU that delivers twice the performance of the one used in Quest 2. It will also come in a 40% slimmer profile.
-
Apple's upcoming XR headset, Vision Pro, heavily emphasizes spatial computing (removing controllers all together; instead, you navigate by using your eyes, hands, and voice), has a high-resolution display (with more pixels than a 4K TV for each eye), passive cooling, wireless connectivity, and a hefty price tag of $3,499. Price aside, these features could make Apple's headset the most immersive and realistic XR experience on the market, potentially opening new possibilities for productivity, education, and entertainment. Apple is smartly focusing on AR, messaging content outside of gaming, but has a VR mode as well.
Opportunity
I’ve laid out my view of the landmark events driving consumer adoption of the internet and VR. There are noticeable patterns. The first phase of adoption was driven mainly by hardware and UI/UX breakthroughs and iterations. Advancement in infrastructure (specifically wireless mobile networks) is a dominant driver regardless of phase.
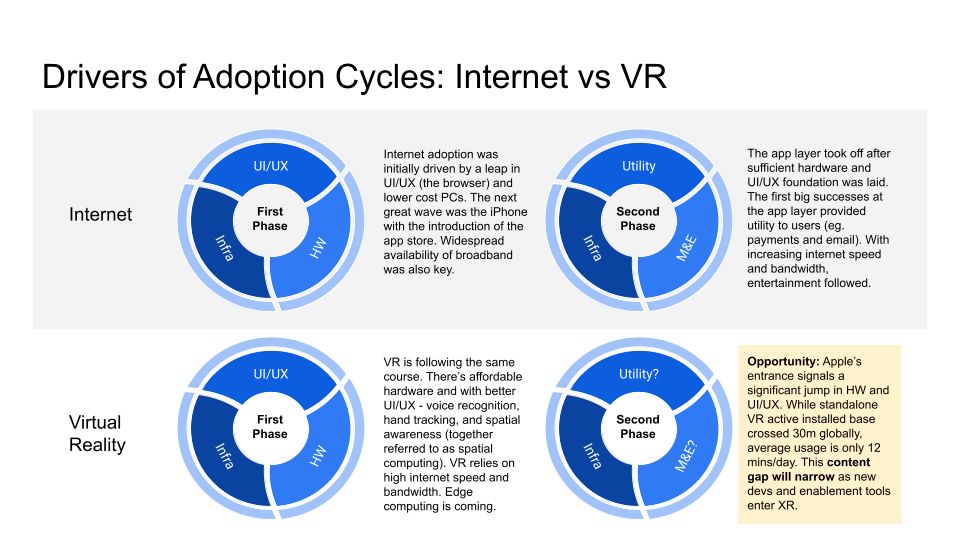
This first phase for the internet was about a 10-12 year period. Apple’s entrance with the iPhone, marked the big hardware and user experience leap forward that ended the first phase and began the second. The second phase of adoption was driven initially by the layering of utility apps on the hardware and infrastructure that had matured enough to support robust applications. Next came entertainment. In other words, first needs, then desires.
Similarly, the first phase for VR has been characterized by eight years of hardware and UI/UX breakthroughs and iterations like standalone headsets and hand tracking. The second phase for VR seems imminent. However, if history is a guide, the open question with respect to phase two is what will be the utility app for VR? The internet had powerful utility apps (email, payments). As did the smartphone (if nothing else, you could make calls and text). But why might we need VR? Is it enough that online utility apps are extensible to VR or does VR need its own unique utility use cases? Further, is utility even necessary for wide adoption or is entertainment sufficient?
It seems that entertainment is not sufficient (at least the entertainment that’s currently available). A 2019 IDC survey found that VR headset owners spend only about 6 hours per month using their device. This translates to just 12 minutes per day (there’s no data to suggest that this has improved). Not only is usage low, but there’s also concern that attrition is high. The Washington Post recently reported that new Quest owners only use the headsets for a few weeks. Others claim that monthly active users are below ten percent.
There could be a number of reasons for the low usage and high churn. First, it’s just too much work. There's significant friction in the experience. When I first connected my Quest 2 headset, it took much longer to set up than other devices. I also had to find a how-to video on YouTube because instructions were sparse. Second, there needs to be more entertainment value beyond gaming. Buying games represents a recurring expense (per title cost) that is a barrier to entry for the general public. Third, whether it’s utility or entertainment, VR needs that one thing you can only experience with a VR headset.
Drawbacks notwithstanding, VR is one of the highest potential value spaces. According to Newzoo, there are over 30 million active standalone VR headsets worldwide (and likely tens of millions more that aren’t active). The marginally active users (which are the majority) are primed for great content and the inactive users might dust off their headsets if incentivized with the right content.
Apple entering is a big leap forward for XR because it completely resets expectations (high) for hardware and user experience advancements to come. Apple’s UI/UX isn’t superficial, it runs up and down the Vision Pro tech stack. VisionOS, Apple’s first spatial operating system, is the most obvious example. But it’s the subtle advances in the user experience that add up. For instance, setup/configuration is transformed by scanning your face with the TrueDepth sensor on the iPhone so your headset comes custom fit to your face. Also, reviewers say that the eye tracking experience feels “magical” - allowing your eyes to function like a mouse, capturing where you focus your attention as you navigate. This combined with hand tracking (pinch your fingers together to select) creates an entirely new user experience.
Apple also highlighted productivity features such as porting your Mac screen into the headset display together with a bluetooth keyboard and trackpad - this is beginning to check the utility box we discussed. From an entertainment standpoint, there’s $2 billion of low hanging fruit in the form of 3D box office releases. In 2022, 3D showings accounted for 7.7% of all ticket sales (“Avatar: The Way of The Water” was 4% by itself). 3D movies are ripe for a straight-to-Vision Pro distribution model.
The impact of Vision Pro will be a rising tide that lifts all boats. More directly, Apple’s entrance signals that the market is ready and will be a strong forcing function for developers to imagine and build new XR experiences. We’re entering the second phase where I expect to see novel utility use cases and great entertainment content from creatives and developers.
In order to build these XR experiences, developers (especially those new to 3D) will need tools an order of magnitude better than what exists today. Enablement is one of the areas where value will accrue first and is why I’m excited about AI developer tools that reduce the time and cost of 3D asset creation, lossless compression, and UGC as well as other opportunities in the XR developer stack.
References
- Quest 2 units through Q2 2022
- PS5 units through Q2 2022
- PS5 units through February 2023
- Quest 2 units through February 2023
- Quest 2 hardware constraint
- Size of Metaverse economy
- US population by year
- Percent of US population online
- Gmail users
- US ecommerce value
- Facebook users
- Unity market share
- Netflix Users
- YouTube Users
- AirBnB Users
- VR headset Installed base
- Oculus Rift release
- HTC Vive release
- Samsung Gear VR release
- Oculus Quest release
- Meta Quest 2 release
- HTC Vive 3 release
- Meta Quest 3 release
- Apple Vision Pro
- VR usage
- Apple Vision Pro review
- Global Box Office revenue 2022
- 3D Box Office percent 2022
[story continues]
tags