
Table of Links
III. TDA Approach to analyzing multiple time series
A. Obtaining point cloud from stock price time-series
B. EE due to the 2008 Financial crisis
C. EE due to COVID-19 pandemic
D. Impact of COVID-19 on different Indian sectors
VII. Acknowledgments and References
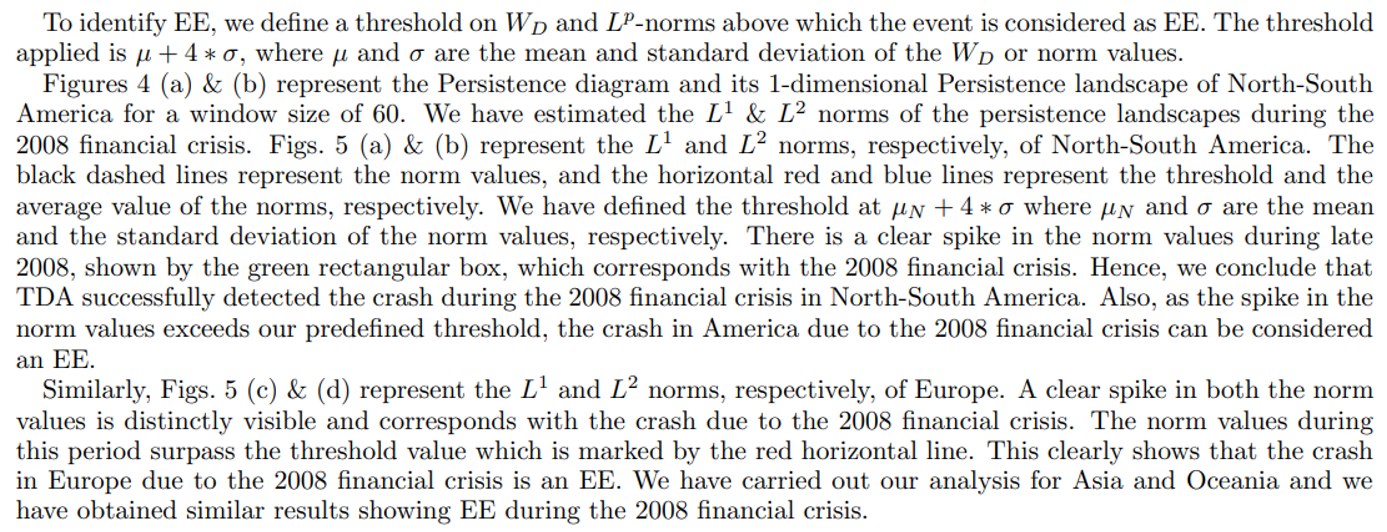
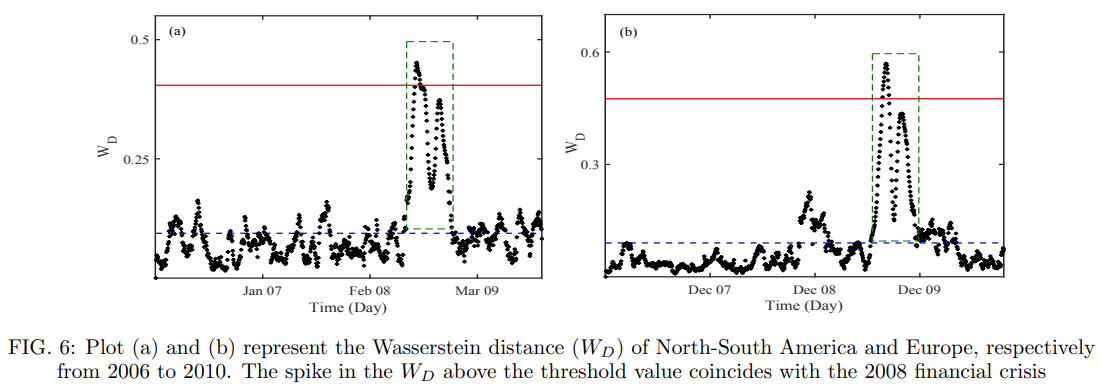
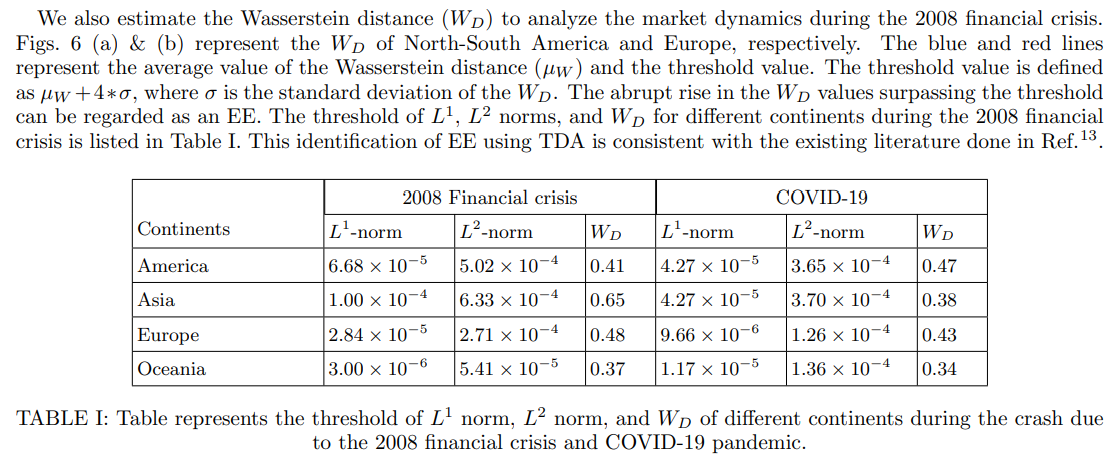
B. EE due to the 2008 Financial crisis
Authors:
(1) Anish Rai, Department of Physics, National Institute of Technology Sikkim, Sikkim, India-737139;
(2) Buddha Nath Sharma, Department of Physics, National Institute of Technology Sikkim, Sikkim, India-737139;
(3) Salam Rabindrajit Luwang, Department of Physics, National Institute of Technology Sikkim, Sikkim, India-737139;
(4) Md.Nurujjaman, Department of Physics, National Institute of Technology Sikkim, Sikkim, India-737139;
(5) Sushovan Majhi, Data Science Program, George Washington University, USA, 20052.
This paper is available on arxiv under CC BY 4.0 DEED license.
[story continues]
tags