
Internet of Vehicles, or IoV, is the product of the marriage between the automotive industry and IoT. IoV data is expected to get larger and larger, especially with electric vehicles being the new growth engine of the auto market. The question is: Is your data platform ready for that? This post shows you what an OLAP solution for IoV looks like.
What is special about IoV data?
The idea of IoV is intuitive: to create a network so vehicles can share information with each other or with urban infrastructure. What‘s often under-explained is the network within each vehicle itself. On each car, there is something called Controller Area Network (CAN) that works as the communication center for the electronic control systems. For a car traveling on the road, the CAN is the guarantee of its safety and functionality, because it is responsible for:
-
Vehicle system monitoring: The CAN is the pulse of the vehicle system. For example, sensors send the temperature, pressure, or position they detect to the CAN; controllers issue commands (like adjusting the valve or the drive motor) to the executor via the CAN.
-
Real-time feedback: Via the CAN, sensors send the speed, steering angle, and brake status to the controllers, which make timely adjustments to the car to ensure safety.
-
Data sharing and coordination: The CAN allows for data exchange (such as status and commands) between various devices, so the whole system can be more performant and efficient.
-
Network management and troubleshooting: The CAN keeps an eye on devices and components in the system. It recognizes, configures, and monitors the devices for maintenance and troubleshooting.
With the CAN being that busy, you can imagine the data size that is traveling through the CAN every day. In the case of this post, we are talking about a car manufacturer who connects 4 million cars together and has to process 100 billion pieces of CAN data every day.
IoV data processing
To turn this huge data size into valuable information that guides product development, production, and sales is the juicy part. Like most data analytic workloads, this comes down to data writing and computation, which are also where challenges exist:
-
Data writing at scale: Sensors are everywhere in a car: doors, seats, brake lights... Plus, many sensors collect more than one signal. The 4 million cars add up to a data throughput of millions of TPS, which means dozens of terabytes every day. With increasing car sales, that number is still growing.
-
Real-time analysis: This is perhaps the best manifestation of "time is life". Car manufacturers collect the real-time data from their vehicles to identify potential malfunctions, and fix them before any damage happens.
-
Low-cost computation and storage: It's hard to talk about huge data size without mentioning its costs. Low cost makes big data processing sustainable.
From Apache Hive to Apache Doris: a transition to real-time analysis
Like Rome, a real-time data processing platform is not built in a day. The car manufacturer used to rely on the combination of a batch analytic engine (Apache Hive) and some streaming frameworks and engines (Apache Flink, Apache Kafka) to gain near real-time data analysis performance. They didn't realize they needed real-time that bad until real-time was a problem.
Near Real-Time Data Analysis Platform
This is what used to work for them:
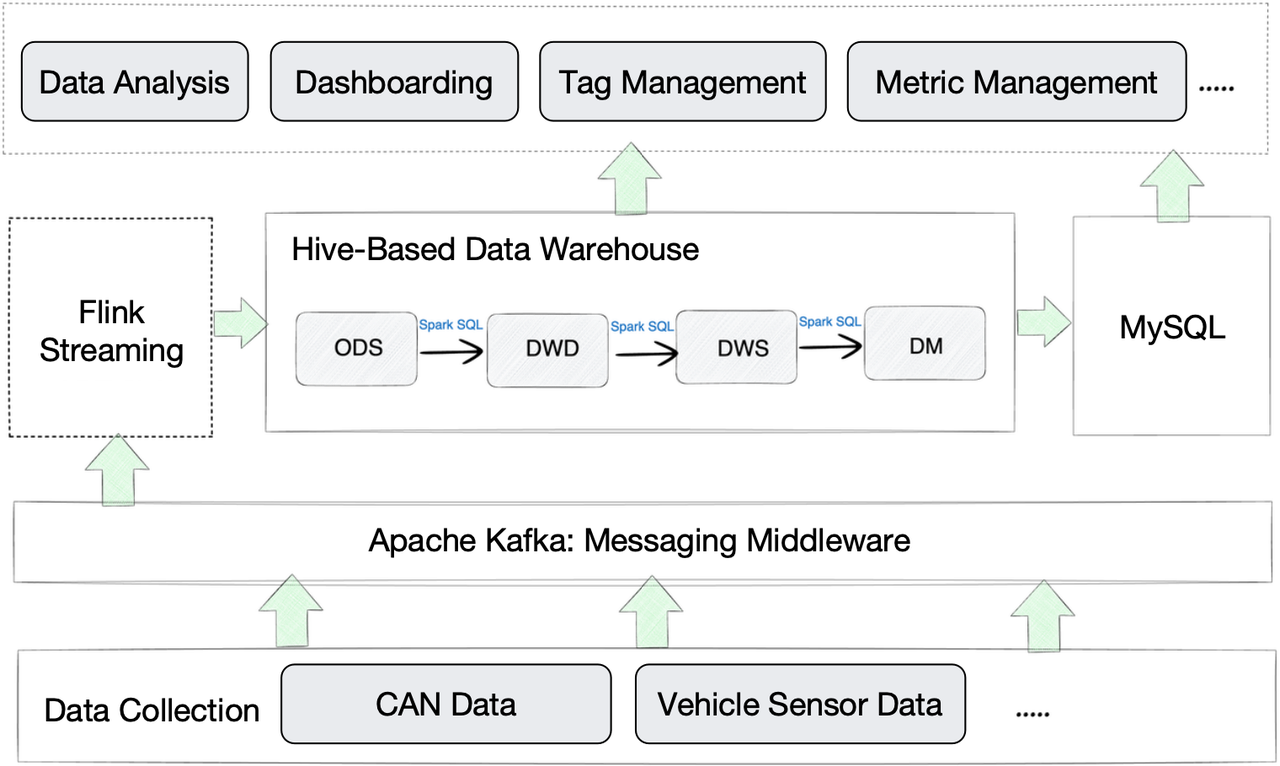
Data from the CAN and vehicle sensors are uploaded via 4G network to the cloud gateway, which writes the data into Kafka. Then, Flink processes this data and forwards it to Hive. Going through several data warehousing layers in Hive, the aggregated data is exported to MySQL. At the end, Hive and MySQL provide data to the application layer for data analysis, dashboarding, etc.
Since Hive is primarily designed for batch processing rather than real-time analytics, you can tell the mismatch of it in this use case.
-
Data writing: With such a huge data size, the data ingestion time from Flink into Hive was noticeably long. In addition, Hive only supports data updating at the granularity of partitions, which is not enough for some cases.
-
Data analysis: The Hive-based analytic solution delivers high query latency, which is a multi-factor issue. Firstly, Hive was slower than expected when handling large tables with 1 billion rows. Secondly, within Hive, data is extracted from one layer to another by the execution of Spark SQL, which could take a while. Thirdly, as Hive needs to work with MySQL to serve all needs from the application side, data transfer between Hive and MySQL also adds to the query latency.
Real-Time Data Analysis Platform
This is what happens when they add a real-time analytic engine to the picture:
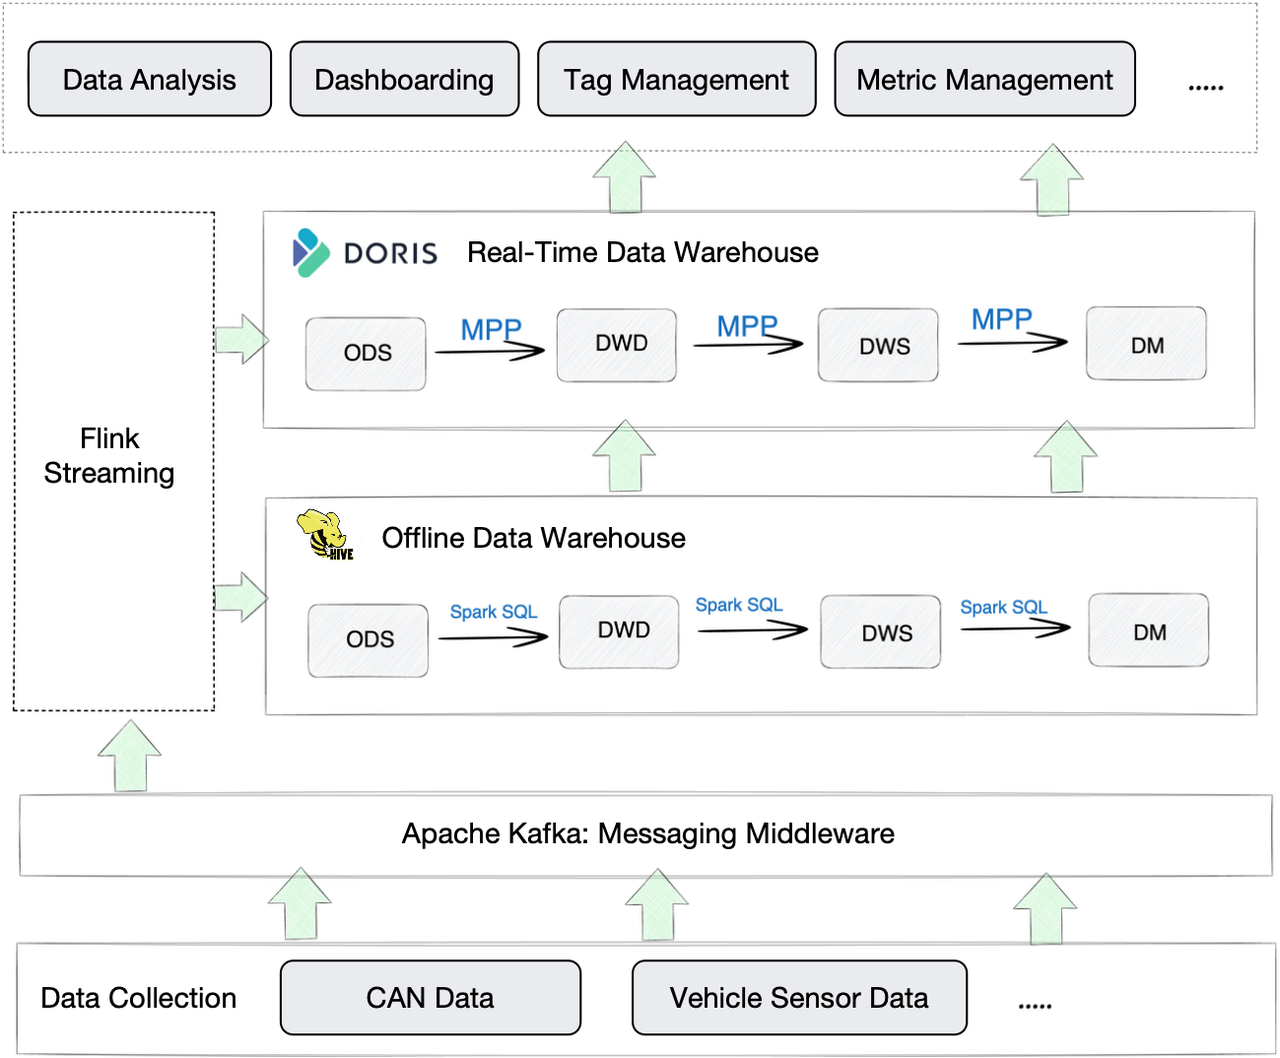
Compared to the old Hive-based platform, this new one is more efficient in three ways:
-
Data writing: Data ingestion into Apache Doris is quick and easy, without complicated configurations and the introduction of extra components. It supports a variety of data ingestion methods. For example, in this case, data is written from Kafka into Doris via Stream Load, and from Hive into Doris via Broker Load.
-
Data analysis: To showcase the query speed of Apache Doris by example, it can return a 10-million-row result set within seconds in a cross-table join query. Also, it can work as a unified query gateway with its quick access to external data (Hive, MySQL, Iceberg, etc.), so analysts don't have to juggle between multiple components.
-
Computation and storage costs: Apache Doris provides the Z-Standard algorithm that can bring a 3~5 times higher data compression ratio. That's how it helps reduce costs in data computation and storage. Moreover, the compression can be done solely in Doris so it won't consume resources from Flink.
A good real-time analytic solution not only stresses data processing speed, it also considers along your data pipeline and smoothens every step of it. Here are two examples:
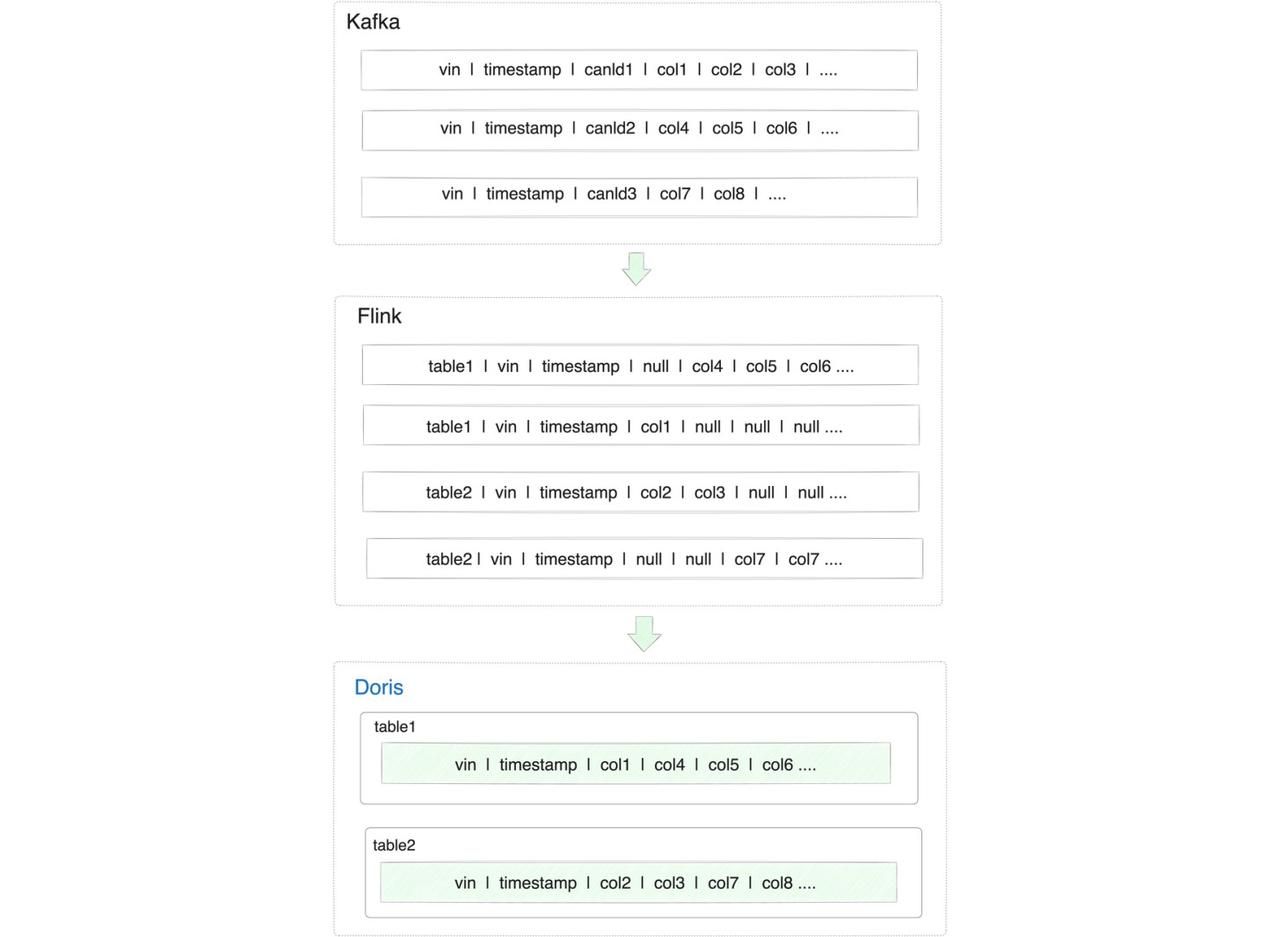
1. The arrangement of CAN data
In Kafka, CAN data was arranged by the dimension of CAN ID. However, for the sake of data analysis, analysts had to compare signals from various vehicles, which meant to concatenate data of different CAN ID into a flat table and align it by timestamp. From that flat table, they could derive different tables for different analytic purposes. Such transformation was implemented using Spark SQL, which was time-consuming in the old Hive-based architecture, and the SQL statements are high-maintenance. Moreover, the data was updated by batch daily, which meant they could only get data from a day ago.
In Apache Doris, all they need is to build the tables with the Aggregate Key model, specify VIN (Vehicle Identification Number) and timestamp as the Aggregate Key, and define other data fields by REPLACE_IF_NOT_NULL. With Doris, they don't have to take care of the SQL statements or the flat table, but are able to extract real-time insights from real-time data.
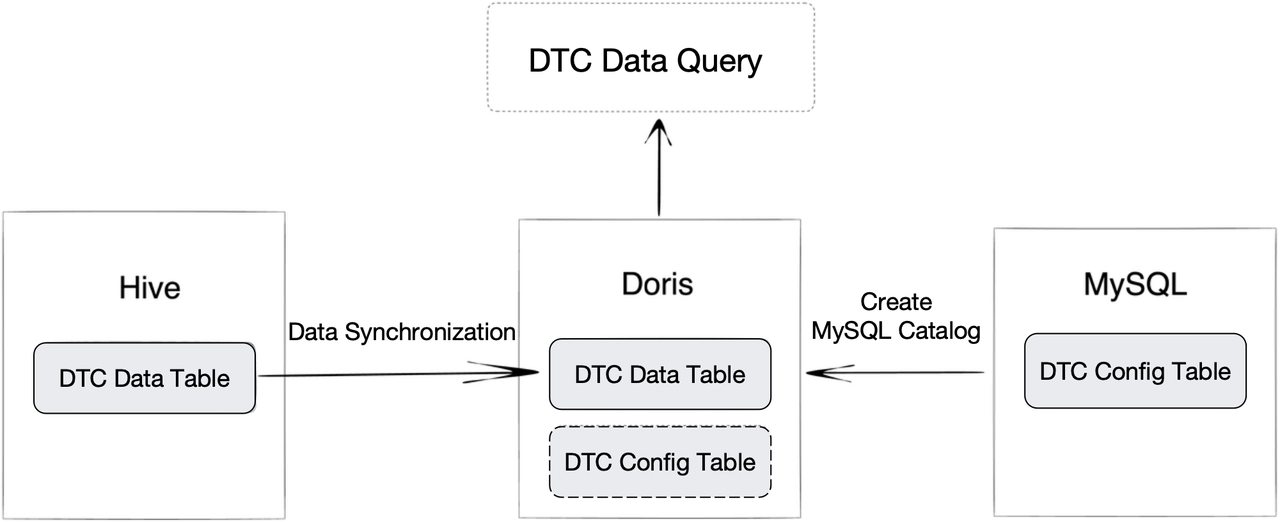
2. DTC data query
Of all CAN data, DTC (Diagnostic Trouble Code) deserves high attention and separate storage, because it tells you what's wrong with a car. Each day, the manufacturer receives around 1 billion pieces of DTC. To capture life-saving information from the DTC, data engineers need to relate the DTC data to a DTC configuration table in MySQL.
What they used to do was to write the DTC data into Kafka every day, process it in Flink, and store the results in Hive. In this way, the DTC data and the DTC configuration table were stored in two different components. That caused a dilemma: a 1-billion-row DTC table was hard to write into MySQL, while querying from Hive was slow. As the DTC configuration table was also constantly updated, engineers could only import a version of it into Hive on a regular basis. That meant they didn't always get to relate the DTC data to the latest DTC configurations.
As is mentioned, Apache Doris can work as a unified query gateway. This is supported by its Multi-Catalog feature. They import their DTC data from Hive into Doris, and then they create a MySQL Catalog in Doris to map to the DTC configuration table in MySQL. When all this is done, they can simply join the two tables within Doris and get real-time query response.
Conclusion
This is an actual real-time analytic solution for IoV. It is designed for data at really large scale, and it is now supporting a car manufacturer who receives 10 billion rows of new data every day in improving driving safety and experience.
Building a data platform to suit your use case is not easy, I hope this post helps you in building your own analytic solution.
Also published here.
[story continues]
tags