Introduction
At the early stage, most startups skip observability entirely — it's too expensive or too complex for a tiny VPS. But flying blind slows down every product decision and turns every incident into a guessing game. Here's how I fit a complete monitoring stack into just 1 GB of RAM.
I'm a Go developer at a major BigTech company and a co-founder of Blije, an AI-powered relationship advisor. Basically, it's a Telegram bot that receives a user's question via the long-polling model, adds a prompt to it, sends it to an LLM, receives a response, and sends it back to the user. Conversation context and user data are stored in PostgreSQL. There is a single Go application instance, plus a cron job that sends notifications asking users for product feedback. Docker Compose orchestrates the multi-container setup.
My team also includes a product manager responsible for product development. He needs to quickly test ideas, see which channels work, and track engagement and retention — all at minimal cost.
Constraints
For deployment, I chose a free VPS on cloud.ru, the Free Tier plan (this is not an ad, you can pick any provider and VPS you like). 4 GB of RAM and 30 GB of disk space are enough to test the hypothesis.
|
Service |
mem_limit |
mem_reservation |
|---|---|---|
|
PostgreSQL |
1200 MB |
800 MB |
|
Bot |
512 MB |
256 MB |
|
Cron |
128 MB |
64 MB |
|
Total (application) |
~1.8 GB |
~1.1 GB |
Out of the 4 GB, almost 2 GB are already used by the application, plus the operating system and Docker overhead. The whole monitoring stack has to fit into what is left.
The Need for Observability
The first inconvenience is that during deployment I often have to check the logs. To do this, I connect to the server via SSH and check the logs.
# -f — follow mode. Without it, the command prints current logs and exits
# --tail 50 — limits initial output to the last 50 lines
# bot — shows logs only for the bot container
docker compose logs -f --tail 50 bot
The second issue is that the product manager constantly needs data on new users. For example, how many users who registered today sent one message, two or more messages, or five or more messages. To get this, I need to run a database query, which is neither convenient nor fast.
SELECT
      msg_count,                              -- number of messages
      COUNT(*) AS users_count                 -- how many users sent that many messages
  FROM (
      SELECT
          u.id,                               -- user ID
          COUNT(m.id) AS msg_count            -- count each user's messages
      FROM users u
      JOIN messages m                         -- join with the messages table
          ON m.user_id = u.id                 -- by user ID
          AND m.role = 1                      -- only user messages (not bot responses)
      WHERE u.created_at >= CURRENT_DATE      -- user registered today
        AND u.created_at < CURRENT_DATE + INTERVAL '1 day'  -- until end of today
      GROUP BY u.id                           -- group by user
  ) sub                                       -- subquery: each user + their message count
  GROUP BY msg_count                          -- group by message count
  ORDER BY msg_count;                         -- sort ascending
Additionally, we needed metrics for:
- How many users pressed the start button (new users), with support for dynamic labels (payload after start)
- How many users completed onboarding and sent their first message (active users)
- Users who returned on the n-th day after registration (retention)
We wanted all of this to be available through a simple, user‑friendly interface with dashboards, so the product manager could check the data he needs on his own. I also needed a fast way to see service issues — error counts and LLM response times. All of this had to be done quickly, by myself, within the 2 GB RAM limit.
Choosing the Stack
The Three Pillars of Observability
If you've read "Building Microservices" by Sam Newman or "Microservices Patterns" by Chris Richardson, you're familiar with the three pillars of observability: metrics, logs, and traces. Traces are necessary when a request passes through a chain of microservices. They allow you to see how much time the request spends in each service and make optimization decisions. In my case, it's a single application instance and a database. Therefore, I decided not to use tracing.
That leaves two pillars: logs and metrics.
Comparing Tools
I compared tools based on popularity, ease of integration, and most importantly RAM usage was the main constraint and the deciding factor.
Logs:
|
Tool |
GitHub Stars |
Min. RAM |
Purpose |
|---|---|---|---|
|
Elasticsearch |
76k |
1–2 GB |
Full-text search, indexes entire log contents |
|
Loki |
27.6k |
128–256 MB |
Stores logs, indexes only labels (not content) |
Elasticsearch is a popular tool for enterprise solutions that indexes every word in every log entry. However, its RAM usage is above our limits because full‑text indexing is very resource‑intensive.
Loki, developed by Grafana Labs, was introduced in 2018 as "Prometheus for logs." Loki's core idea is to make logging as cheap and operationally simple as possible by giving up on building a full search index for the text inside log lines.
Metrics:
|
Tool |
GitHub Stars |
Min. RAM |
Purpose |
|---|---|---|---|
|
PostgreSQL (event table) |
— |
0 MB (already deployed) |
Write events to a table; Grafana supports PostgreSQL as a datasource |
|
ClickHouse |
45.7k |
1–2 GB |
Column-based OLAP database for analytics |
|
Prometheus |
62.6k |
256–512 MB |
Pull model, stores time-series data, native Go client library |
|
VictoriaMetrics |
16.3k |
128–256 MB |
Prometheus-compatible, more RAM-efficient |
ClickHouse is a columnar database designed for analytics. It excels at fast aggregations and is well-suited for event data. However, its minimum RAM usage starts at 1 GB, closer to 2 GB in practice. It also requires significant time for setup and integration. It is more of an enterprise analytics solution, but overkill for a single service.
Prometheus has a native Go client library. It uses a pull model: it scrapes metrics from applications on its own (no need to configure push logic in your code). It is straightforward to set up and integrate. There is a lot of tutorials available online. It has an enormous ecosystem: thousands of ready-made Grafana dashboards and exporters for any database or service. The downsides are poor horizontal scalability and no built-in long-term storage. Currently, we only need metrics for the recent 30-day window, and our user base is too small to worry about scalability.
VictoriaMetrics is an excellent Prometheus-compatible alternative that is even more memory-efficient. However, Prometheus is already the de facto standard; documentation and Go examples are built around it, and the 100–200 MB difference is not critical.
Another option is to store metrics directly in PostgreSQL by creating an events table. Grafana supports PostgreSQL as a datasource out of the box. This could have been a good place to start, but making a separate table and writing migrations takes more time. Moreover, PostgreSQL performs best with a 70–80% read / 20–30% write ratio; here the situation is reversed.
Visualization:
Grafana integrates with all the systems listed above. A single UI for everything. Additionally, dashboards can be stored in the repository alongside the code. It uses 128–256 MB of RAM.
|
Component |
Tool |
RAM ( |
Role |
|---|---|---|---|
|
Metrics |
Prometheus |
512 MB |
Metrics collection and storage |
|
Logs |
Loki |
256 MB |
Log storage |
|
Log collector |
Promtail |
64 MB |
Reads Docker logs and ships them to Loki (standard for Loki) |
|
Visualization |
Grafana |
256 MB |
Dashboards for metrics and logs |
The whole monitoring stack is about 1 GB. Together with the application (1.8 GB), the total is about 2.8 GB out of 4 GB. This leaves enough free memory for the OS and Docker.
Architecture Diagram
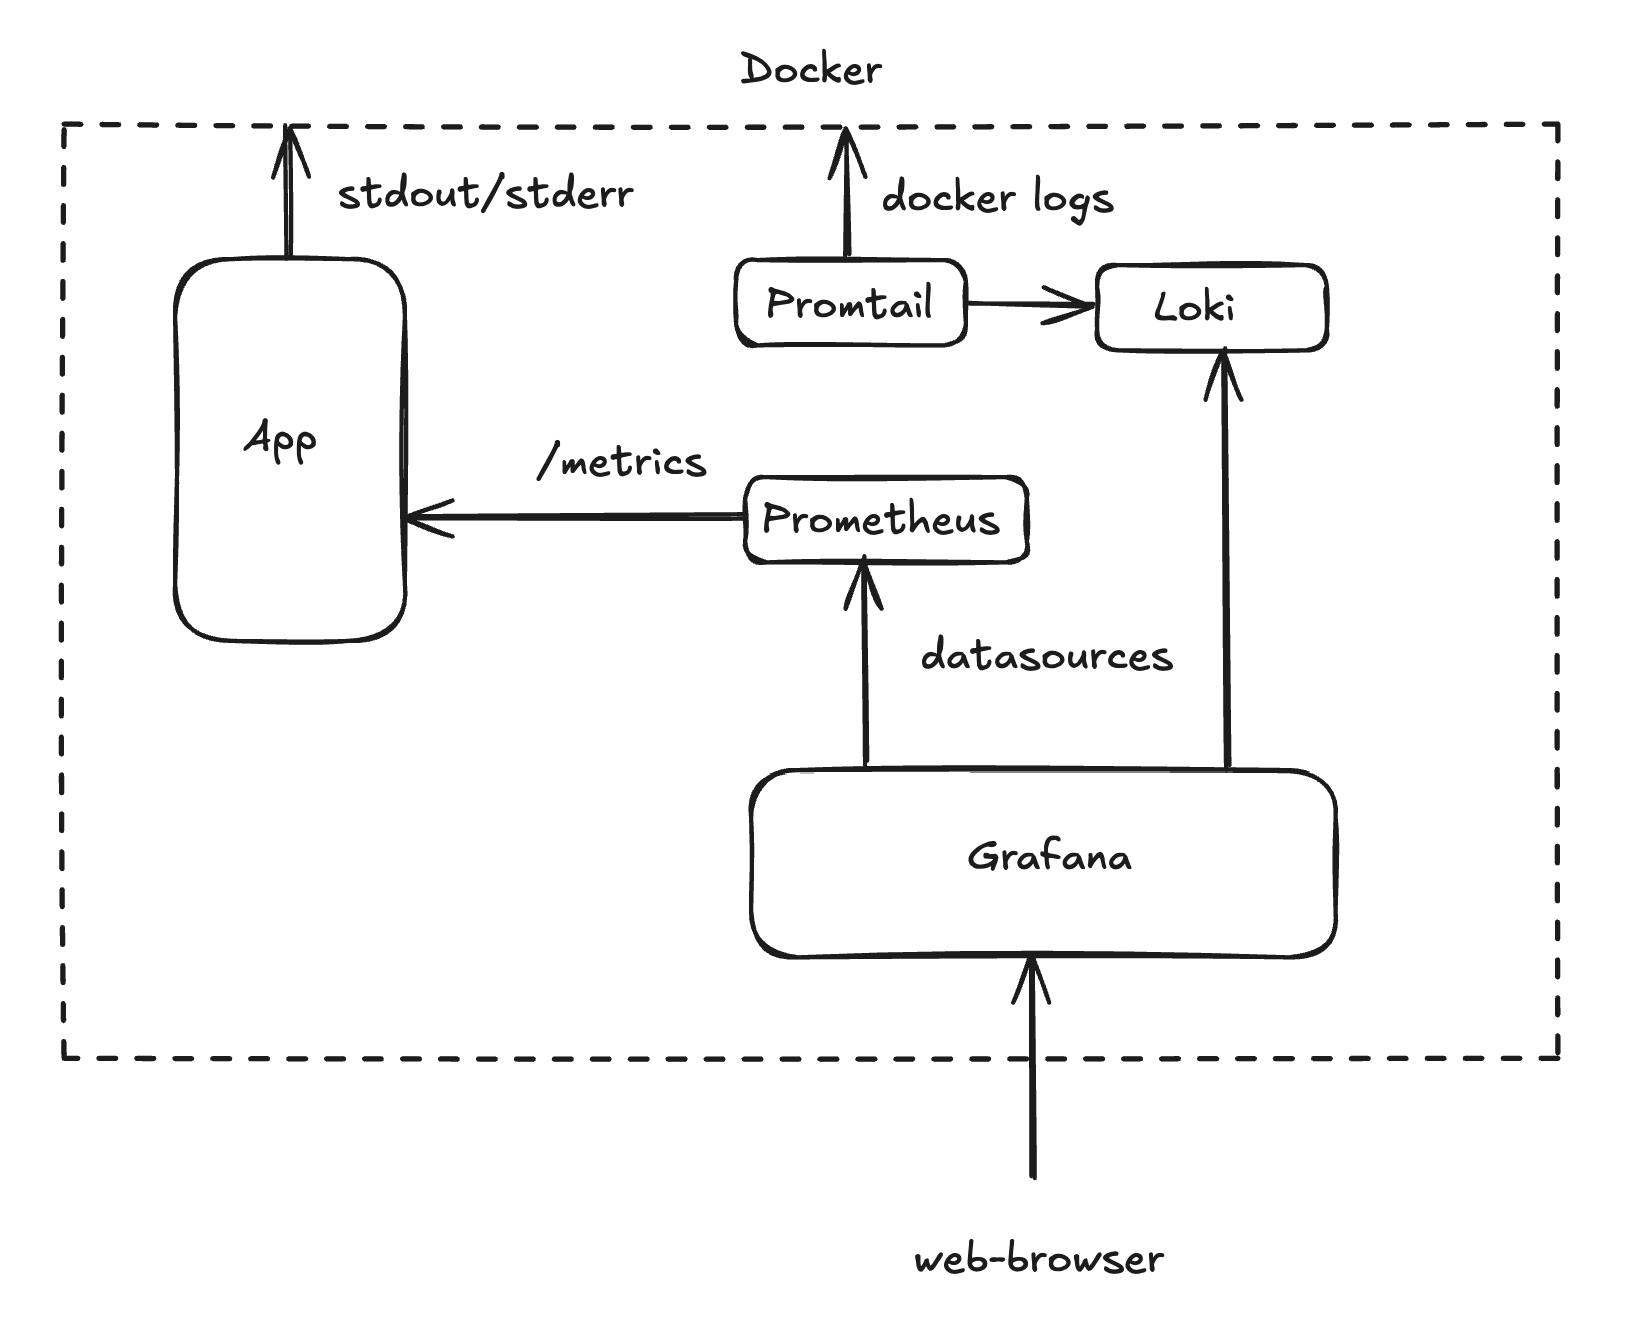
Logs (push model). The application writes logs to stdout. Promtail reads stdout/stderr of all project containers via the Docker socket and pushes them to Loki. Loki saves the logs to disk.
Metrics (pull model). The application provides an HTTP endpoint at /metrics. Every 10 seconds, Prometheus scrapes the current metric values. The advantage of the pull model is that the application does not depend on Prometheus. If the monitoring system stops working, the application keeps running normally.
Visualization. Grafana is connected to both Prometheus and Loki — a single UI with two data sources.
Code Changes
What needs to change in the service itself so that it starts producing logs and exposing metrics.
Structured Logs
The first thing Loki needs is structured logs in JSON format. JSON format turns each log line into a record that can be easily filtered, indexed, and analyzed programmatically.
Starting with Go 1.21, the standard library includes log/slog, which supports structured logging. A clear benefit: no outside tools or libraries are needed.
Logger initialization looks like this:
// cmd/service/main.go

logHandler := slog.NewJSONHandler(os.Stdout, &slog.HandlerOptions{
    Level: slog.LevelInfo,
})
logger := slog.New(logHandler).With("service", "bot")
Level: slog.LevelInfo sets the minimum logging level. This means only logs at the Info level and above will be written to stdout. Every log record will automatically have "service": "bot" so you can filter logs by application. For example, cron will have "service": "cron".
Here is an example of a log call and what it prints to the console:
logger.Info("bot started successfully")
{
  "time":"2026-02-03T14:29:10.080Z",
  "level":"INFO",
  "msg":"bot started successfully",
  "service":"bot"
}
HTTP Endpoint for Prometheus
Prometheus operates on a pull model. It visits an endpoint and collects metrics by itself. We need to start an HTTP server that provides metrics at the /metrics path.
// cmd/service/main.go

import "github.com/prometheus/client_golang/prometheus/promhttp"

metricsServer := &http.Server{Addr: ":9091", Handler: promhttp.Handler()}
go func() {
    logger.Info("starting metrics server", "addr", ":9091")
    if err := metricsServer.ListenAndServe(); err != nil && !errors.Is(err, http.ErrServerClosed) {
        logger.Error("metrics server error", "error", err)
    }
}()
The server listens on port 9091 in a separate goroutine, so it does not block the main application thread. promhttp.Handler() is a built-in handler that returns all registered metrics in the format that Prometheus expects.
We also add a graceful shutdown for the metrics server. If Prometheus tries to collect metrics after the server has already stopped during a container shutdown, errors will show up in the logs.
// cmd/service/main.go — within the graceful shutdown block

<-ctx.Done()
logger.Info("shutdown signal received, starting graceful shutdown")

// Stop the bot
logger.Info("stopping telegram bot")
b.Stop()

// Stop the metrics server
logger.Info("stopping metrics server")
metricsCtx, metricsCancel := context.WithTimeout(context.Background(), 5*time.Second)
defer metricsCancel()
if err := metricsServer.Shutdown(metricsCtx); err != nil {
    logger.Error("failed to shutdown metrics server", "err", err)
}

// Close the database connection pool
logger.Info("closing database connection")
pgConn.Close()
The bot stops first so that no new messages come in. The metrics server stops last, giving Prometheus enough time to collect the final values.
Adding Metrics
To send events, we use promauto. It is a Prometheus helper that automatically adds metrics when they are created. Below is a closer look at the metric types we use.
Counter (an Event Occurred)
Counter is the simplest type. It increases monotonically. Ideal for counting events.
// internal/pkg/metrics/metrics.go

// New users — simple counter
NewUsersTotal = promauto.NewCounter(
    prometheus.CounterOpts{
        Name: "new_users_total",
        Help: "Total number of newly registered users",
    },
)

// Successfully sent review notifications
ReviewSentTotal = promauto.NewCounter(
    prometheus.CounterOpts{
        Name: "review_sent_total",
        Help: "Total number of successfully sent review notifications",
    },
)
When registering a new user:
// internal/app/usecase/start_chat.go

user = &models.User{
    ID:        request.UserID,
    CreatedAt: time.Now(),
}
metrics.NewUsersTotal.Inc()  // +1 to the counter
In Prometheus, you can now query by the new_users_total metric.
CounterVec (Event + Category)
CounterVec is the same counter but with labels. It lets you split events into categories.
// internal/pkg/metrics/metrics.go

// /start commands by source — where the user came from
StartTotal = promauto.NewCounterVec(
    prometheus.CounterOpts{
        Name: "start_total",
        Help: "Total number of /start commands by source",
    },
    []string{"source"},  // label
)

// Errors by type — what errors and how many
MessagesErrorsTotal = promauto.NewCounterVec(
    prometheus.CounterOpts{
        Name: "errors_total",
        Help: "Total number of message processing errors by type",
    },
    []string{"type"},  // label
)
When /start is pressed, we capture the source from the UTM tag (link payload):
// internal/app/delivery/bot/handle_start.go

source := "direct"
if payload := c.Message().Payload; payload != "" {
    source = payload
}
metrics.StartTotal.WithLabelValues(source).Inc()
Now Prometheus creates separate time series: start_total{source="direct"}, start_total{source="my_ad"}, etc.
Histogram (How Values Are Spread)
Histogram is used to see how values are spread out. For example, LLM response times. Buckets are time ranges measured in seconds. Since an LLM in reasoning mode can take a long time, the buckets go up to 180 seconds. This way we can see how many requests fall into each time range.
// internal/pkg/metrics/metrics.go

LLMRequestDuration = promauto.NewHistogram(
    prometheus.HistogramOpts{
        Name:    "llm_request_duration_seconds",
        Help:    "Duration of LLM requests in seconds",
        Buckets: []float64{1, 2, 5, 10, 20, 30, 60, 120, 180},
    },
)
Then we measure the LLM call duration:
// internal/app/usecase/handle_message.go

llmStart := time.Now()
response, err := s.llmClient.Send(ctx, llmMessages, models.ThinkingLLMMode)
metrics.LLMRequestDuration.Observe(time.Since(llmStart).Seconds())
Now in Grafana, we can visualize this data using percentiles.
Docker Compose Configuration
At this point, the application writes structured logs to the console and provides metrics on a separate endpoint. Next, we need to set up the tools that collect and display this data. We add the following to docker-compose.yml, which already has settings for the application, the database, and the cron job.
Loki
loki:
  image: grafana/loki:3.0.0            # Stable Loki 3.x release
  container_name: sex_doctor_loki
  restart: unless-stopped               # Restart on crash, but not on manual stop
  mem_limit: 256m                       # Strict memory limit
  mem_reservation: 128m                 # Guaranteed minimum RAM
  volumes:
    - ./config/loki/loki-config.yaml:/etc/loki/local-config.yaml:ro  # Read-only config
    - loki_data:/loki                   # Persistent volume for chunks and indexes
  command: -config.file=/etc/loki/local-config.yaml
  networks:
    app_network:
      ipv4_address: 172.25.0.10         # Fixed IP within the Docker network
  healthcheck:                          # Grafana starts only when Loki is ready
    test: ["CMD-SHELL", "wget --no-verbose --tries=1 --spider http://localhost:3100/ready || exit 1"]
    interval: 30s
    timeout: 10s
    retries: 5
Without mem_limit, Loki with default settings can grow and use up all the free memory. The loki_data volume makes sure logs are kept after container restarts. The healthcheck stops Grafana from starting before Loki is ready.
Promtail
promtail:
  image: grafana/promtail:3.0.0
  container_name: sex_doctor_promtail
  restart: unless-stopped
  mem_limit: 64m
  mem_reservation: 32m
  volumes:
    - ./config/promtail/promtail-config.yaml:/etc/promtail/config.yaml:ro
    - /var/run/docker.sock:/var/run/docker.sock:ro
  command: -config.file=/etc/promtail/config.yaml
  depends_on:
    loki:
      condition: service_healthy         # Wait for Loki to become ready
  networks:
    app_network:
      ipv4_address: 172.25.0.11
Notice the /var/run/docker.sock:/var/run/docker.sock:ro mount. This gives Promtail access to the Docker socket so it can automatically find containers and read their console output. The :ro (read-only) flag is important for security: Promtail can only read container data but cannot control them.
Prometheus
prometheus:
  image: prom/prometheus:v2.51.0
  container_name: sex_doctor_prometheus
  restart: unless-stopped
  mem_limit: 512m
  mem_reservation: 256m
  volumes:
    - ./config/prometheus/prometheus.yml:/etc/prometheus/prometheus.yml:ro
    - prometheus_data:/prometheus         # Metric data saves across restarts
  command:
    - '--config.file=/etc/prometheus/prometheus.yml'
    - '--storage.tsdb.path=/prometheus'
    - '--storage.tsdb.retention.time=30d' # Retain metrics for 30 days
    - '--web.enable-lifecycle'            # Allows config reload without restart
  expose:
    - "9090"                             # Port accessible only within the Docker network
  # No ports are open to the outside; Prometheus can only be reached through Grafana.
  networks:
    app_network:
      ipv4_address: 172.25.0.12
  healthcheck:
    test: ["CMD-SHELL", "wget --no-verbose --tries=1 --spider http://localhost:9090/-/healthy || exit 1"]
    interval: 30s
    timeout: 10s
    retries: 5
expose opens a port only inside the Docker network, while ports would make it open to the outside. Prometheus holds all metrics — there is no reason for it to be reachable from the internet. All data goes only through Grafana.
Grafana
grafana:
  image: grafana/grafana:10.4.0
  container_name: sex_doctor_grafana
  restart: unless-stopped
  mem_limit: 256m
  mem_reservation: 128m
  environment:
    GF_SECURITY_ADMIN_USER: ${GRAFANA_ADMIN}          # Login from .env
    GF_SECURITY_ADMIN_PASSWORD: ${GRAFANA_PASSWORD}   # Password from .env
    GF_USERS_ALLOW_SIGN_UP: "false"                   # Disable registration
    # Brute-force protection
    GF_SECURITY_DISABLE_BRUTE_FORCE_LOGIN_PROTECTION: "false"
    GF_AUTH_LOGIN_MAXIMUM_INACTIVE_LIFETIME_DURATION: "7d"
    GF_AUTH_LOGIN_MAXIMUM_LIFETIME_DURATION: "30d"
    GF_AUTH_BASIC_ENABLED: "true"
  volumes:
    - grafana_data:/var/lib/grafana
    - ./config/grafana/provisioning:/etc/grafana/provisioning:ro   # Datasources and dashboards
    - ./config/grafana/dashboards:/var/lib/grafana/dashboards:ro   # Dashboard JSON files
  ports:
    - "3000:3000"                        # The only port exposed externally
  depends_on:
    prometheus:
      condition: service_healthy
    loki:
      condition: service_healthy
  networks:
    app_network:
      ipv4_address: 172.25.0.13
Grafana is the only monitoring service with a port open to the outside. It needs to be reached from a web browser. For security, the login and password are taken only from the .env file, new user sign-ups are turned off, brute-force protection is turned on, and session time is limited.
Volumes and Network
volumes:
  postgres_data:       # PostgreSQL data
  loki_data:           # Loki chunks and indexes
  prometheus_data:     # Prometheus TSDB storage
  grafana_data:        # Grafana settings, dashboards, plugins
Monitoring System Configuration
Config files for each system are stored in a separate config/ folder. Docker Compose loads these configs as read-only when starting up.
Prometheus
# config/prometheus/prometheus.yml

global:
  scrape_interval: 15s       # Default scrape interval: every 15 seconds
  evaluation_interval: 15s   # How often to check recording and alerting rules

scrape_configs:
  # Prometheus tracks itself — basic system metrics
  - job_name: 'prometheus'
    static_configs:
      - targets: ['localhost:9090']

  # Our bot — the primary scrape target
  - job_name: 'bot'
    static_configs:
      - targets: ['bot:9091']   # Docker DNS: service name + port
    scrape_interval: 10s        # Scrape the application more often — 10s instead of 15s
Prometheus collects metrics from itself to see the load on the monitoring system, and from the application.
Loki
# config/loki/loki-config.yaml

auth_enabled: false    # Authentication not required

server:
  http_listen_port: 3100
  grpc_listen_port: 9096

common:
  instance_addr: 127.0.0.1
  path_prefix: /loki
  storage:
    filesystem:            # Store on disk
      chunks_directory: /loki/chunks
      rules_directory: /loki/rules
  replication_factor: 1    # Single instance — no replication needed
  ring:
    kvstore:
      store: inmemory      # In-memory coordination — single instance

query_range:
  results_cache:
    cache:
      embedded_cache:
        enabled: true
        max_size_mb: 100   # Query cache — makes repeated queries in Grafana run faster

schema_config:
  configs:
    - from: 2020-10-24
      store: tsdb           # Time-series database storage for indexes
      object_store: filesystem
      schema: v13
      index:
        prefix: index_
        period: 24h         # New index every 24 hours

limits_config:
  retention_period: 168h    # 7 days — a compromise between history and disk usage

compactor:
  working_directory: /loki/compactor
  compaction_interval: 10m       # Compact data every 10 minutes
  retention_enabled: true        # Enable automatic deletion of old logs
  retention_delete_delay: 2h     # Don't delete immediately, protects against deleting by mistake
  retention_delete_worker_count: 150
  delete_request_store: filesystem
Compaction in Loki is not a heavy task like in traditional databases. It combines small index files into bigger ones so that queries don't have to open hundreds of small files, and it handles retention — removing data older than the set period. We keep metrics in Prometheus for 30 days, but logs take more disk space, so 7 days is enough. The embedded_cache: max_size_mb setting makes sure that when you use Explore in Grafana and change time ranges several times, the cache makes repeated queries faster. Without it, each query reads data from disk again.
Promtail
# config/promtail/promtail-config.yaml

server:
  http_listen_port: 9080

positions:
  filename: /tmp/positions.yaml    # Remembers the read offset to avoid duplicate entries after restarts

clients:
  - url: http://loki:3100/loki/api/v1/push   # Where to push logs

scrape_configs:
  - job_name: docker
    docker_sd_configs:
      - host: unix:///var/run/docker.sock     # Discover containers via the Docker API
        refresh_interval: 5s                  # Refresh every 5 seconds
    relabel_configs:
      # Container name as a label: /sex_doctor_bot → container="sex_doctor_bot"
      - source_labels: ['__meta_docker_container_name']
        regex: '/(.*)'
        target_label: 'container'
      # Extract service name: /sex_doctor_bot → service="bot"
      - source_labels: ['__meta_docker_container_name']
        regex: '/sex_doctor_(.*)'
        target_label: 'service'
      # Filter: collect logs ONLY from project containers
      - source_labels: ['__meta_docker_container_name']
        regex: '/sex_doctor_.*'
        action: keep              # Ignore everything that doesn't match
    pipeline_stages:
      # Parse JSON logs from the bot
      - match:
          selector: '{service="bot"}'      # Only for bot logs
          stages:
            - json:
                expressions:
                  level: level             # Extract the "level" field from JSON
                  msg: msg
                  time: time
            - labels:
                level:                     # Turn level into a Loki label
In docker_sd_configs, we set up how Promtail connects to the Docker socket and automatically finds all the containers we need. The pipeline_stages section is needed so Promtail reads JSON logs and turns the level field into a label. Because of this, we can filter logs by level in Grafana.
Grafana
Grafana can pick up data sources and dashboards from files at container startup. This means the configuration is stored in the repository together with the code, tracked by version control, and no extra setup through the UI is needed.
# config/grafana/provisioning/datasources/datasources.yaml

apiVersion: 1

datasources:
  - name: Prometheus
    type: prometheus
    uid: prometheus
    access: proxy           # Grafana proxies requests to Prometheus
    url: http://prometheus:9090
    isDefault: true         # Prometheus as the default datasource
    editable: true

  - name: Loki
    type: loki
    access: proxy
    url: http://loki:3100
    editable: true
# config/grafana/provisioning/dashboards/dashboards.yaml

apiVersion: 1

providers:
  - name: 'default'
    orgId: 1
    folder: ''
    type: file
    disableDeletion: false
    updateIntervalSeconds: 10          # Check for updates every 10 seconds
    options:
      path: /var/lib/grafana/dashboards   # Path to dashboard JSON files inside the container
Dashboards are stored in config/grafana/dashboards/ as JSON files and are loaded into the container:
config/grafana/
├── dashboards/
│   ├── bot-overview.json       # Overview: new users, active users, errors
│   ├── engagement.json         # User engagement and retention
│   └── llm-performance.json    # LLM response times
└── provisioning/
    ├── datasources/
    │   └── datasources.yaml    # Prometheus + Loki
    └── dashboards/
        └── dashboards.yaml     # Path to JSON files
Upon deployment, the Grafana instance reads the provisioning files, connects Prometheus and Loki as data sources, and loads three dashboards. How to configure the UI via JSON files is covered below.
Logs and Metrics via Explore
To check that everything we set up above is working, we can use the Explore section. It works as a playground for running manual queries against Loki and Prometheus.
Verifying Logs
Open Explore, select the Loki datasource, filter by container {service="bot"}, and you'll see all application logs for the selected time range.
Loki is working, JSON logs are parsed, and we can filter by level — for example, to see only errors.
Verifying Metrics via Prometheus
Switch the datasource to Prometheus and select the start_total metric for new users, filtered by container.
Something is clearly wrong. A Counter in Prometheus is a value that only goes up. The graph looks like a staircase: each /start adds +1, and the number never goes down. What we actually want to see is not the running total but how many events happened in each time period. Also, Explore is meant for debugging. Our real goal was to show metrics as clean, ready-made dashboards without needing to write any queries by hand in Grafana.
Building Dashboards in Grafana
Bot Overview
This is what the product manager sees when they open Grafana. Three rows of Stat panels: for 24 hours, 7 days, and 30 days. The Stat panel in Grafana visualizes a single specific value with optional sparklines and thresholds. Each row has four metrics: new users, active users, errors, and average LLM response time.
Below the Stat panels are /start by source tables for 24h, 7d, and 30d. Below that is a Time Series panel showing /start commands by source over time. A Time Series panel in Grafana draws a graph based on time.
Engagement & Retention
The second dashboard is made for a deeper look at the data. It includes retention by day (whether a user came back on the first, second, or third day after using the bot), a first-day activity funnel (sent one message, more than two, more than five), and average message count. The activity funnel uses a Bar Gauge — a panel with horizontal bars. Each bar shows a value and fills up with color based on its size (like a progress bar).
Dashboard List
All dashboards are stored as JSON files in config/grafana/dashboards/ and are loaded automatically when the Grafana instance is deployed.
JSON Dashboard configuration
A dashboard in Grafana is configured via a JSON file. You can build it in the UI and export it, or write it by hand. Let's look at the structure using Bot Overview as an example.
The top level contains dashboard metadata:
{
  "uid": "bot-overview",
  "title": "Bot Overview",
  "tags": ["bot"],
  "refresh": "30s",
  "time": { "from": "now-24h", "to": "now" },
  "panels": [ ... ]
}
refresh: "30s" — the dashboard auto-refreshes every 30 seconds. time — the default time range. Panel configurations are defined in the panels array.
A dashboard is a grid 24 columns wide. Each panel takes up a rectangle set by gridPos:
"gridPos": { "h": 4, "w": 6, "x": 0, "y": 0 }
Where w is width (out of 24 columns), h is height (in relative units), x is offset from the left, and y is vertical position.
Here is how a single Stat panel is structured:
{
  "title": "New Users (24h)",
  "type": "stat",
  "gridPos": { "h": 4, "w": 6, "x": 0, "y": 0 },
  "datasource": { "type": "prometheus", "uid": "prometheus" },
  "targets": [
    {
      "expr": "round(increase(new_users_total[24h]))",
      "legendFormat": "New"
    }
  ],
  "fieldConfig": {
    "defaults": {
      "thresholds": {
        "steps": [
          { "color": "blue", "value": null },
          { "color": "green", "value": 10 }
        ]
      },
      "decimals": 0
    }
  },
  "options": {
    "colorMode": "background",
    "graphMode": "area"
  }
}
type: "stat" — shows a big number. targets.expr — the PromQL query. increase(...) calculates how much the counter grew over the [24h] window (how many new users in 24 hours). round(...) rounds the result to a whole number. thresholds — color rules: below ten is blue, ten or above is green. colorMode: "background" fills the whole panel background, not just the number. graphMode: "area" adds a small area chart behind the number, showing the trend over the chosen time range.
The Problem With New Labels and Its Solution
After deploying new functionality, I noticed that when a metric shows up for the first time, it shows 0 instead of 1. This is especially easy to see in Time Series panels.
{
  "expr": "round(increase(start_total[$__interval]))",
  "legendFormat": "{{source}}",
  "interval": "1m"
}
Why This Happens
The problem is that increase() needs at least two data points inside the window to calculate the difference. When a label first shows up in a time series, there are no earlier data points. There is nothing to compare with, so increase() returns 0.
Solution
If you call .WithLabelValues(...) (without .Inc()) at application startup, Prometheus will start scraping that time series immediately with a value of 0. We add an initialization function and call it in main:
// metrics.go
func Init() {
    // /start direct
    StartTotal.WithLabelValues("direct")

    // other metrics
    ...
}

// main.go
metrics.Init()
What This Approach Does Not Solve
start_total{source} is a metric where source comes from the /start command data. Dynamic labels cannot be set up ahead of time, which means that for each new label value, the first increase() will show 0 instead of 1. One way to fix this would be to keep a list of known source values and set them up in main before they are used. Together with the product manager, we decided that being off by one user per new source is good enough for our needs.
Conclusion
The goal was to build a handy monitoring setup for both a developer and a product manager, with little time and limited memory. Here is what we did:
- The technology stack Prometheus + Loki + Promtail + Grafana was chosen and fit within 1 GB of RAM. The Out-Of-Memory killer has never been triggered.
- Added structured logs to the application code, along with event counters split by category, histograms that group values into time ranges, and a separate HTTP server that provides metrics using the pull approach.
- Added Docker Compose settings for deployment. Prometheus and Loki are not open to the outside. Grafana dashboards are kept in the repository. Grafana has brute-force protection turned on and user sign-ups turned off.
- Three dashboards were built, displaying error counts over time, LLM response times, and user engagement and retention.
- Found problems with how labels show up on dashboards. Fixed it for static labels, and agreed with the product manager on how to handle dynamic labels.
Let’s Connect!
Whether you found this helpful or have questions, I'm always happy to chat. Here's where you can find me and continue the discussion: