Lately many people have been asking how I'm so often early to the new trends and how I make those stunning charts and what do they mean.
It's an app I've built that helps me spot trends early and catch pumps and outliers.
(It's not public yet, but if I get enough interest, I might consider making it accessible to all)
Going to give a quick explanation of how it works and how I use it.
Here's how I find 10X and 100X gems
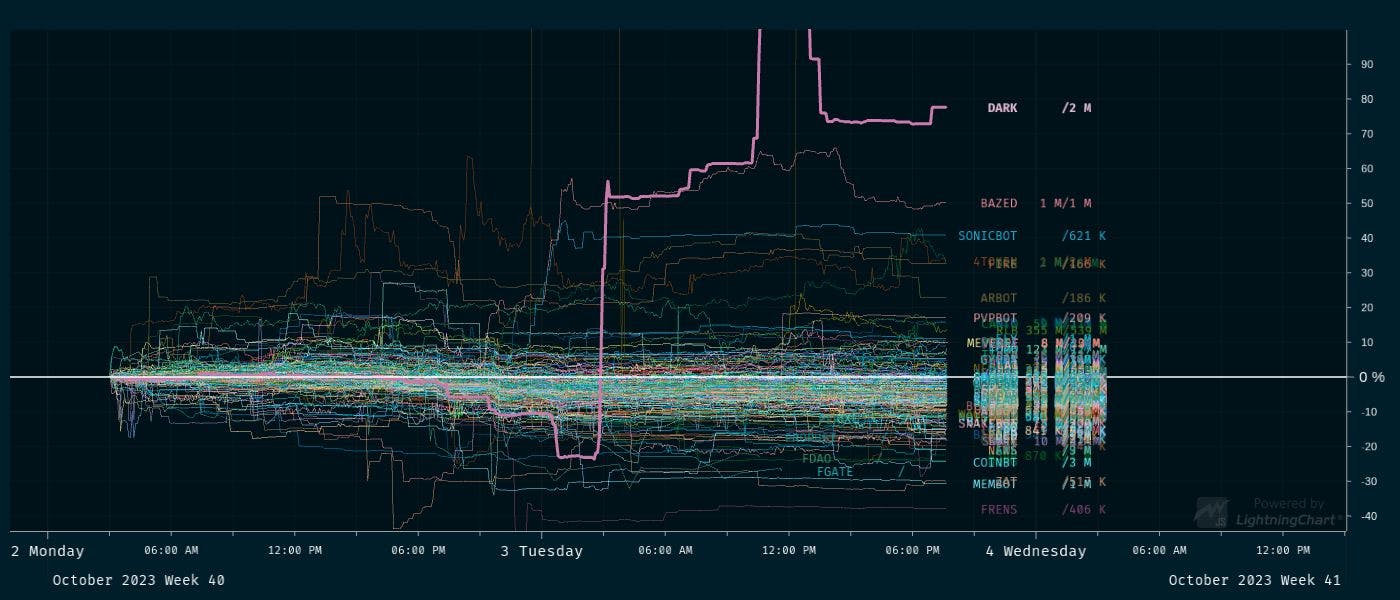
These are called Spaghetti Charts
They are made by taking the price of an asset and converting it to % change since some starting point (current day / week / month etc).
And doing the same for multiple assets so you can compare them to each other.
Why do this, you ask?
By doing this, you can spot outliers and pumps very easily and catch them early. Also, this gives you an easy way to spot longer timeframe trends or old trends resurrecting etc.
The idea stems from momentum investing with a manual touch, where you pick a Universe of assets and long the best performers.
In TradingView you can do smth similar (w/ Compare), but:
- it gets clunky when too many assets
- max number of assets you can add
- limited data (I'm pulling from CG, DEXes, etc)
- you have to add/pick data manually (I just auto pull whole categories (e.g. AI, TG bots)
Why I love this approach:
- Spot trends quick
- Spot outliers
- Condensed overviews of the market in a single chart
- Don't have to open 100s of charts
Here's how I use it:
- plot only top 100/200/500 whatever by mcap
- plot all category (e.g. AI, TG Bots, LSD, etc)
- plot all recently added to CoinGecko or CoinMarketCap
- plot custom watchlist
- plot all up 10% today
- etc
When I've found an outlier or something interesting, I go and check out fundamentals, news and hype. This is where the manual approach comes in.
If I find the dev is cooking something, I might ape.
Let's look at a few recent examples
Here I noticed $PROPHET (@ProphetBots) standing out
$PROPHET
2)
Checked CT - many BIG OG followers, 0 hype, something is cooking behind the scenes 👀
- Noticed $AIMBOT (
@AimBot_Coin) here at ~5$,ended up going to 20$+ and nice juicy rev shared
That's it! Let me know if you'd be interested to try out the app!