Author name: Anton Kolobanov
For our small Incident Support team (just 6 specialists), two metrics are absolutely critical: speed of detection and accuracy of diagnosis.
We receive cases from millions of users across 48 countries where our business operates. When a user case comes in, one of the core tools we rely on — alongside others — is Kibana.
Due to the multifactor nature of our system (microservices, local regulatory specifics, A/B experiments, and more), we often end up searching for a needle in a haystack by analyzing user-related events in logs.
Even for an experienced specialist, this takes time in order to:
- understand what actually happened,
- separate noise from real issues,
- connect technical events with the real user experience.
On average, this kind of analysis takes at least 15 minutes per case, and in ambiguous situations, it can take much longer.
I wanted logs to read like a story, not like a raw event dump.
And yes — this is not a replacement for an engineer, but rather a thinking accelerator.
The Idea
I built an automation in n8n that combines several tools:
- Slack
- Kibana (via Clairvoyance)
- an LLM (Large Language Model)
And turned it into a simple, practical workflow for support specialists.
How It Works
- A dedicated Slack channel is created.
- A specialist sends a user UID into the channel — just a number.
- The automation captures the UID and sends a request to Clairvoyance Kibana using predefined filters.
- All user activity logs for the last 6 hours are fetched.
- If no logs are found, a clear “no activity found” message is posted in the Slack thread.
- If logs exist, they are processed:
- empty entries are removed,
- duplicates are eliminated,
- data is structured and normalized,
- everything is bundled into a single dataset.
- The full log package is sent to an LLM together with a custom prompt tailored to our team’s needs.
- The LLM analyzes the events and returns a human-readable summary (up to 600 characters).
- The response is posted back into the original Slack thread about 2 minutes after the request.
The initial development of this pipeline took about 30 hours, a large portion of which went into properly configuring credentials.
We expect that with active usage, this automation will save the team up to 60 hours per month.
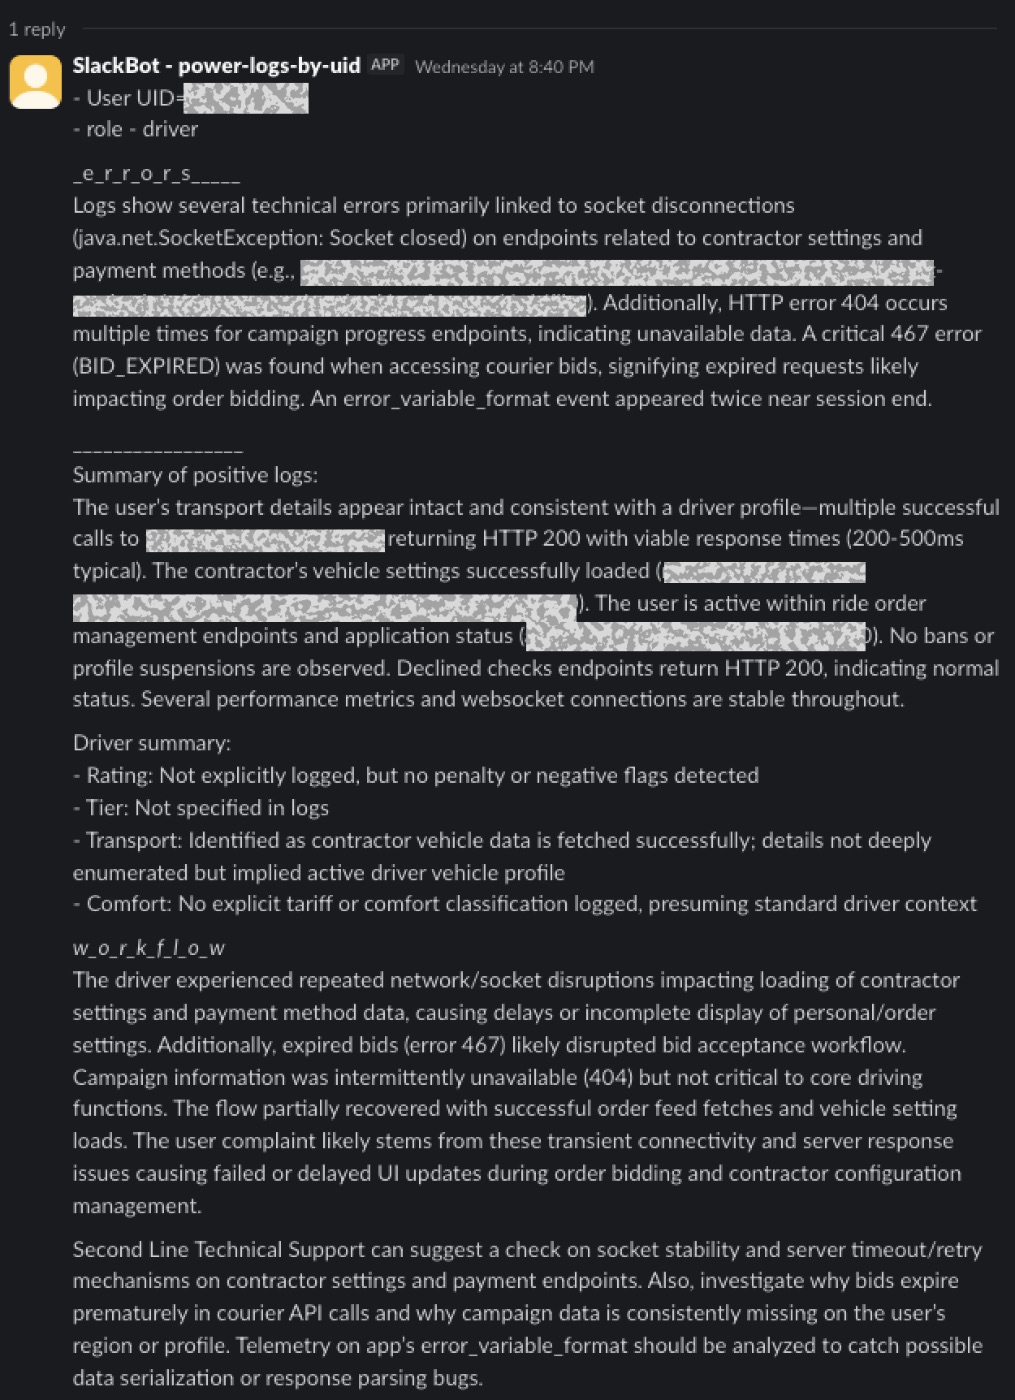
What Does the LLM Actually Answer?
The response is always structured and answers very specific questions:
- What errors were detected?
- A summary of positive (normal) events
- How the errors could have affected the user workflow
- When exactly the issues occurred (timestamps)
- What actions the specialist should take next
As a result, we don’t just see “HTTP 400 on endpoint X”, but real context:
What the user was doing, where they encountered a problem, and how critical it was.
And yes — no sensitive data is ever sent to the LLM.
Core Goals of the Automation
1. Humanizing Log Reading
Kibana is a powerful tool, but reading logs with your eyes is tiring and cognitively expensive—especially when events are spread over time and across multiple services.
I wanted the output to look like a clear explanation, not a technical dump.
2. Reducing Analysis Time
Before automation:
- 15+ minutes per user case
After automation:
- 1–2 minutes (send UID → get summary)
This is especially important during peak load or mass incidents.
3. Enabling Deeper Analysis
The automation doesn’t just save time — it allows us to:
- detect systemic issues faster,
- identify recurring error patterns across users,
- improve specialists’ skills by highlighting new problem areas,
- better understand how the application behaves in real-world usage.
Ultimately, this approach significantly reduces developer time spent investigating issues described only through user experience. Each case comes with a structured analysis backed by concrete log events.
Who Is This Tool For?
Primarily:
- support specialists,
- engineers working with user-facing incidents,
- teams that need to quickly understand “what went wrong” without immediately diving into Kibana.
Is This the Final Version?
No. This is a living tool currently in a quiet testing phase, with a full rollout planned for early 2026.
During testing:
- prompts are refined,
- different LLMs and model versions are compared,
- filtering logic and response templates are improved
Even now, the automation already fulfills its main goal: making logs understandable and saving time.
Pipeline Structure
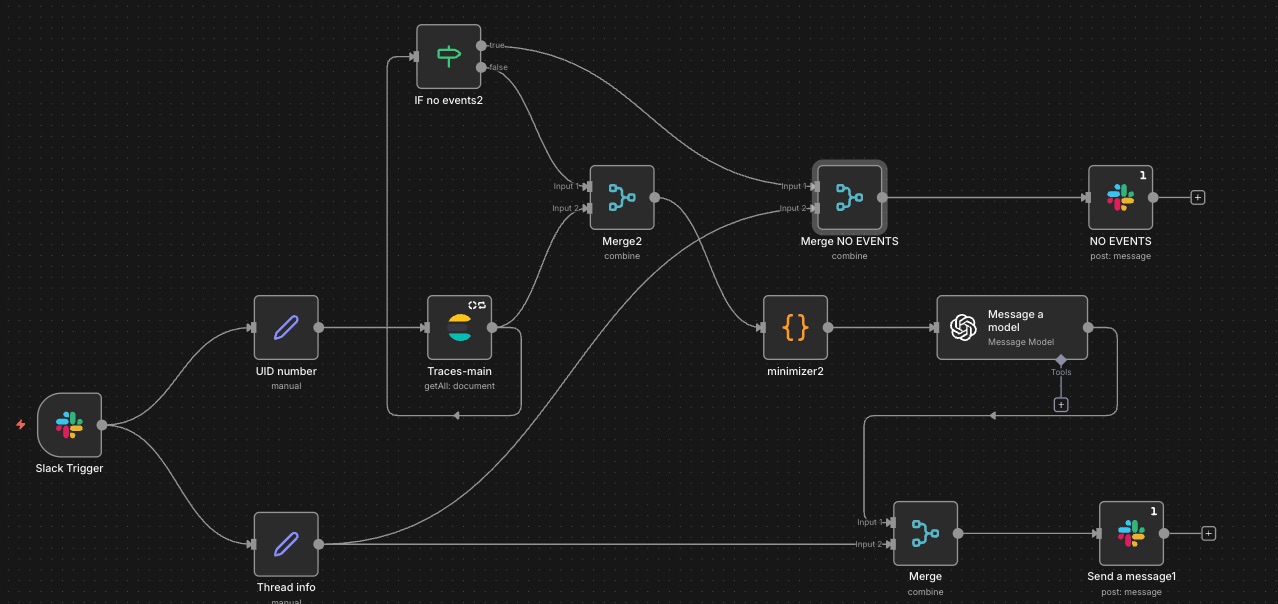
Trigger
The pipeline starts from an event in a dedicated Slack channel (Slack Trigger):
- Event type: new message posted in channel
- Input: a user UID sent as plain text
Data Preparation
The message data is extracted and transformed using Set nodes into the required JSON format:
- Upper branch: UID (as a number)
- Lower branch: thread context (channel ID and thread timestamp)
Log Retrieval
The UID is passed to Kibana (Elasticsearch / Get Many) using the traces-mainindex in Clairvoyance.
Logs are searched byuser_id within a defined time window.
Conditional Logic
An IF node checks whether any events were found:
- No events:
- Data is merged with the thread context
- A predefined “NO EVENTS” message is posted to Slack
- Events found:
- Logs are aggregated, minimized, and normalized
- Data is sent to the LLM for analysis
Response Delivery
The LLM output is merged with the Slack thread context and posted as a reply in the original thread.
Node Details
Slack Trigger
Requires preconfigured Slack credentials and the channel ID (available via Open Channel Details in Slack).
Set Nodes
Used to extract and normalize input data:
uid→ parsed from message text as a number- thread data:
channelthread_ts→ original message timestamp
Elasticsearch Node
Requires Kibana credentials and the index ID (found in Index Management).
Key settings:
limit: 1000 items
(Higher values often caused gateway timeouts.)- Query:
- time range:
now-6h - filter by
user_id - limited source fields
- last 1000 events
- time range:
Code Node (Minimizer)
Prepares logs for LLM analysis:
- normalizes fields (time, content),
- masks potential PII (phone/email — even if not present, as extra protection),
- truncates long values,
- removes empty fields,
- sorts events by time,
- deduplicates similar events,
- computes lightweight statistics (HTTP codes, endpoints),
- builds a compact prompt with the top 500 aggregated events and a strict length limit.
This is critical to avoid sending large, token-expensive payloads to the LLM.
OpenAI Node (Message a Model)
Requires OpenAI credentials and model selection (currently GPT-4.1-Mini during testing).
The prompt is designed from the perspective of a second-line technical support specialist:
- first classify the user (driver/passenger/courier),
- focus on technical errors,
- if no errors exist, analyze business state (documents, bans, profile status),
- follow a strict response template with character limits,
- tie conclusions to concrete endpoints and timestamps,
- separate technical analysis from user-facing workflow impact.
This structure turns raw logs into clear, actionable insights.
Example output available below:
Final Thoughts
This automation doesn’t replace engineers — it helps them think faster. By turning raw logs into short, structured narratives, the team reduces cognitive load and speeds up incident analysis without losing context.
With tools like n8n and modern LLMs, even small teams can build practical, human-friendly observability layers. The key isn’t more data — it’s making systems explain themselves.
[story continues]
tags