If you've ever wanted to experiment with computer vision but don’t have the time to set up a complex development environment, this tutorial is for you. Computer vision can be a great substitute for physical sensors in certain situations—especially when it comes to counting things.
In this tutorial, I’ll walk you through a demo application that we’ve released that uses London's traffic cameras to gauge current congestion by counting vehicles. It’s based on a reusable project template that we’ve created to help you replicate the project. I’ll then show you how to use this template to create your own copy of the project and get it up and running in Quix—a tool to develop and run event streaming applications.
Our demo version of the computer vision application also uses a message broker hosted in Confluent Cloud (fully managed Apache Kafka as a service), but it’s not compulsory to have a Confluent Cloud account to follow the tutorial.
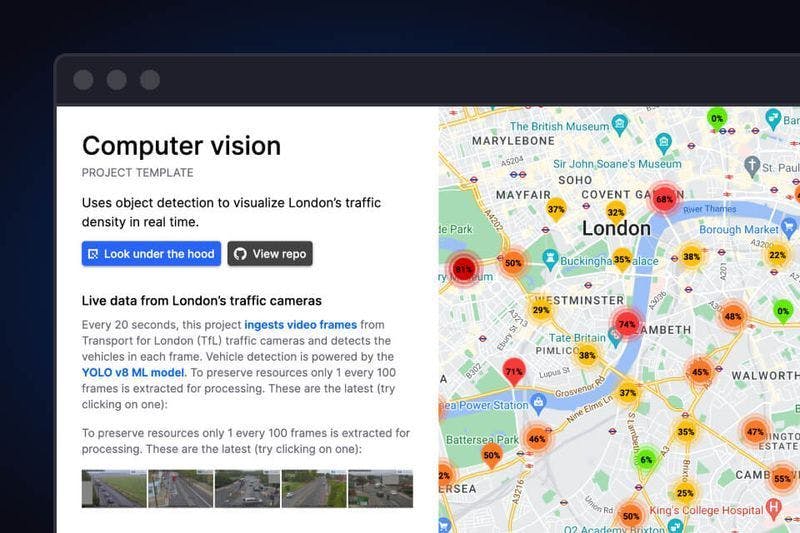
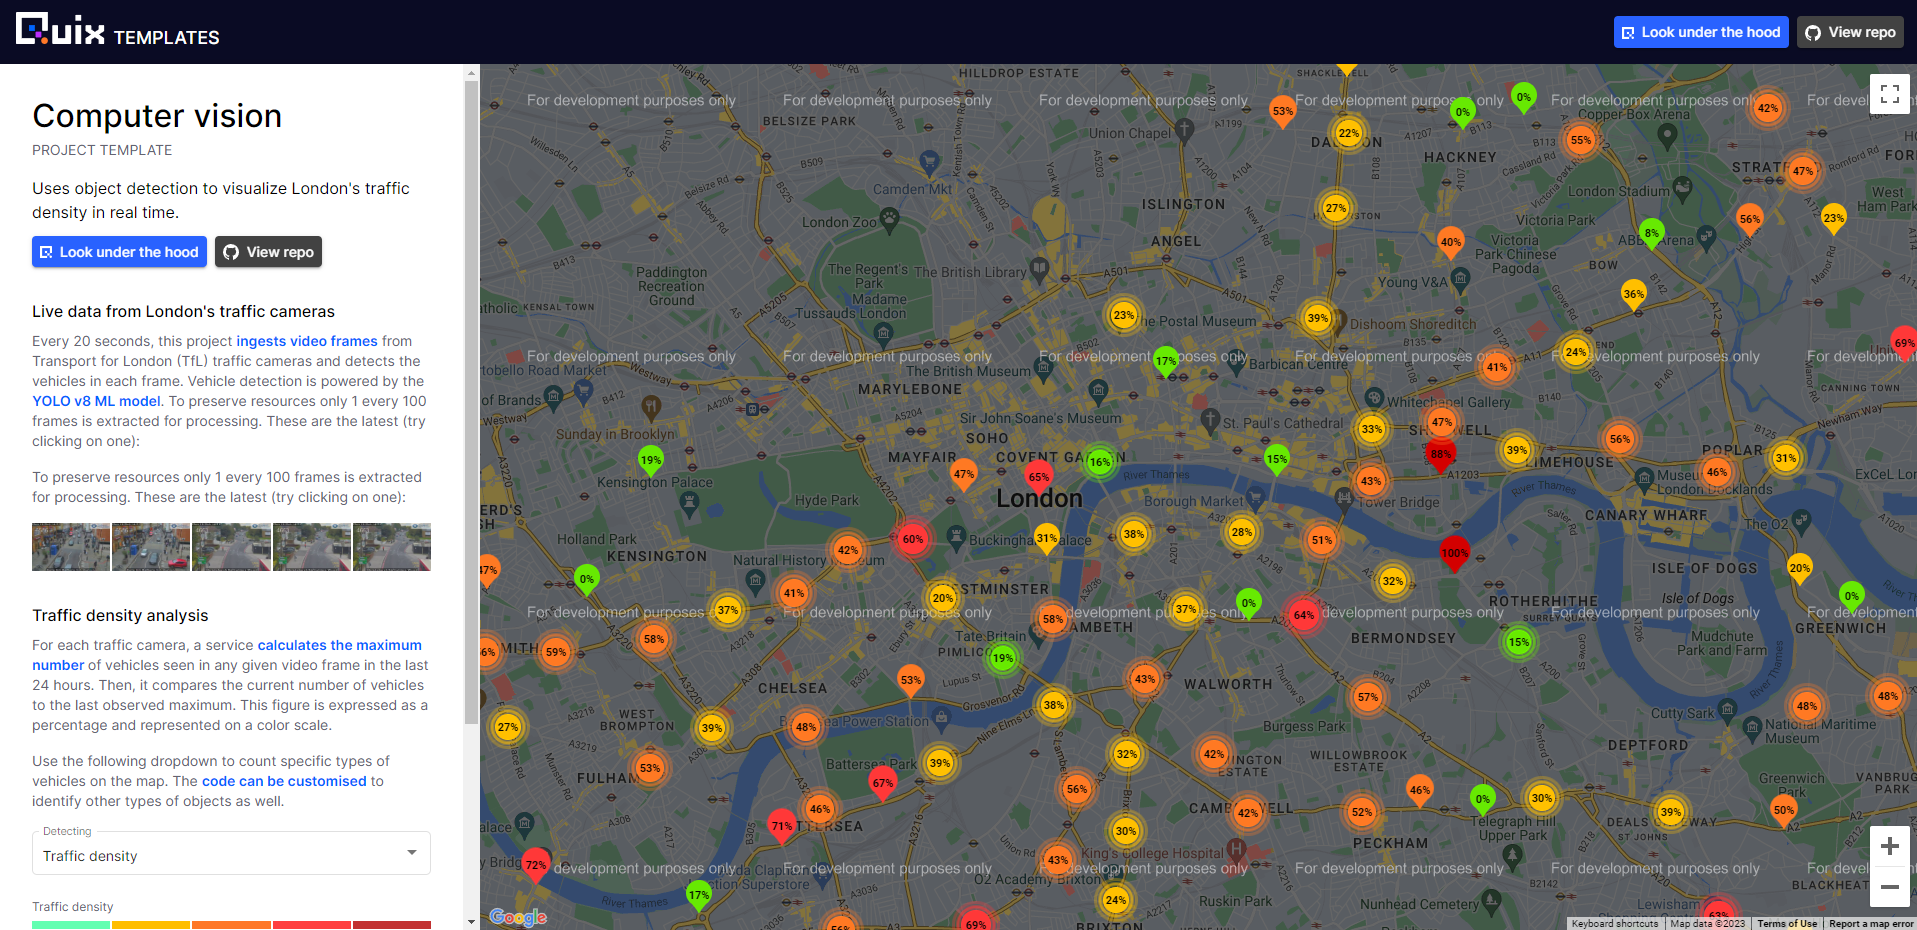
Here’s what the final result should look like:
You can experiment with this demo version live at the following address: https://app-demo-computervisiondemo-prod.deployments.quix.ai/
What is this app doing?
The app is using live feeds from London’s traffic cameras (also known as “Jam Cams”) to count the vehicles and estimate levels of congestion. It then uses visual indicators to show where congestion is occurring on a map of London. The vehicles are counted using an ML model for object detection in images (rather than sensors or GPS data).
The object detection model also classifies vehicles into different types, and you can filter the data by these types.

For example, you can use the “Select object” dropdown to see only the number of buses that all traffic cameras have detected at the current point in time.
Note that the application does not count all the vehicles observed throughout the day, just at the current time (more on that later).
Why use object detection to determine congestion?
Because other methods are not always reliable. For instance, in 2020, a Berlin-based artist managed to create a “virtual” traffic jam on one of the main bridges across the river Spree with nothing but a handcart and 99 second-hand phones. Google Maps then dutifully displayed the area on the map as highly-congested.
For this reason, other types of data are often used to augment GPS-based congestion estimates. This includes historical patterns, sensor data, municipal feeds on scheduled closures and user reported incidents. However, one of the most reliable cross-references is visual recognition of congestion gleaned from traffic cameras (assuming a seagull isn’t blocking the view).

Errant seagulls notwithstanding, computer vision is now being used by governmental organizations to augment traffic data and increase accuracy for traffic volume estimates. For example, on September 22 of last year, Statistics Canada published a paper titled “Traffic volume estimation from traffic camera imagery: Toward real-time traffic data streams” which presented a computer vision-based system to periodically extract vehicle counts from Canadian traffic camera imagery.
Now with Quix, you don’t need a team of research scientists to try something like this out. Any capable developer can give it a try and get up and running within minutes. In this case though, we’re talking more like 60 minutes rather than 5 minutes. It is a big project after all!
To reproduce the project, you’ll need two things:
-
An API key for the Traffic for London API (for more details see this project’s documentation)
-
A free Quix account — if you haven’t created one yet, you can sign up now (you can do it in a few clicks with an existing Google, GitHub or Microsoft account).
Getting your own copy of the project
There are several major steps to getting a copy of the project (and any of our demo applications):
-
Fork our computer vision demo repository from GitHub.
This will make it easy for you to customize your version of the project but still benefit from upstream improvements.
-
Create a project in Quix Cloud, then create a new development environment and link it to your fork.
This will allow you to run and update the application in Quix Cloud under your own account.
-
Update the credentials for external services such as TfL Camera API and Google Maps.
Secrets such as API keys are not transferred into project copies so you’ll need to add these yourself.
After you have the basics set up, we’ll dive into the code and look at how you can adapt it.
Forking the computer vision demo repository
To get a handle on the code, let’s first fork the Computer Vision Demo repository. Why fork rather than clone? Because, later you’ll be bringing that code into your own Quix environment, and using a fork is the easiest way to keep your environment synchronized. You’ll also be able to get any upstream changes we make to the project template.
For the sake of simplicity, I’m assuming you already have a GitHub account. However, you might want to create a specific Git user for this project. Later you’ll be giving Quix SSH access to the repository, and having a separate user is a good way to ensure that Quix does not have more access than it should.
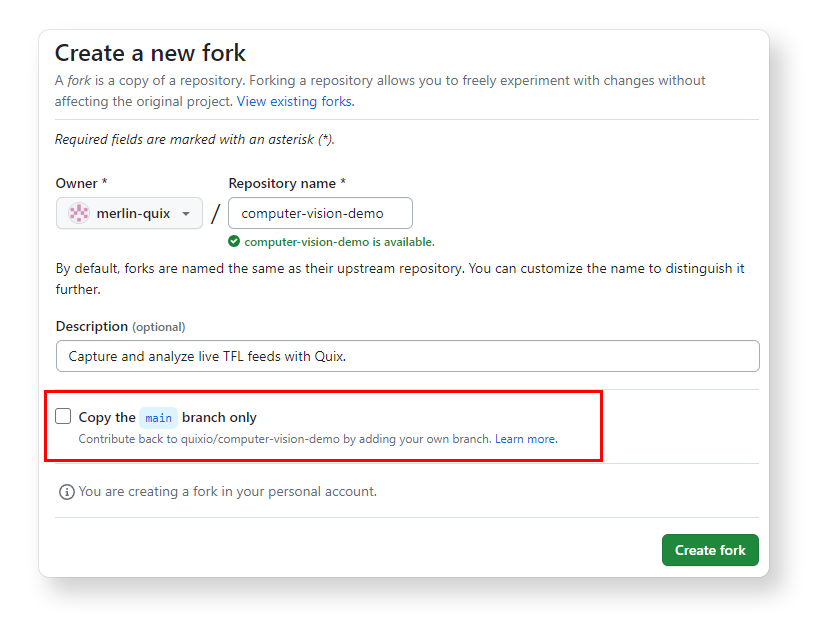
- Open GitHub in your web browser, navigate to the Computer Vision Demo repository (https://github.com/quixio/computer-vision-demo) and click Fork.
-
Make sure you fork all branches (in GitHub's Fork wizard, deselect “Copy the main branch only”). This is because, if you’re using a trial account, you’ll need an alternative branch to create a development environment in Quix Cloud.
-
Creating a new development environment in Quix
Before you can create an environment in Quix, you first need to create a project. During the project creation wizard, you’ll then be asked to add an initial environment. You can add more environments later once you get the hang of things.
To create a project and connect an environment to your forked repo, follow these steps:
-
Log in to Quix and click + New project.
-
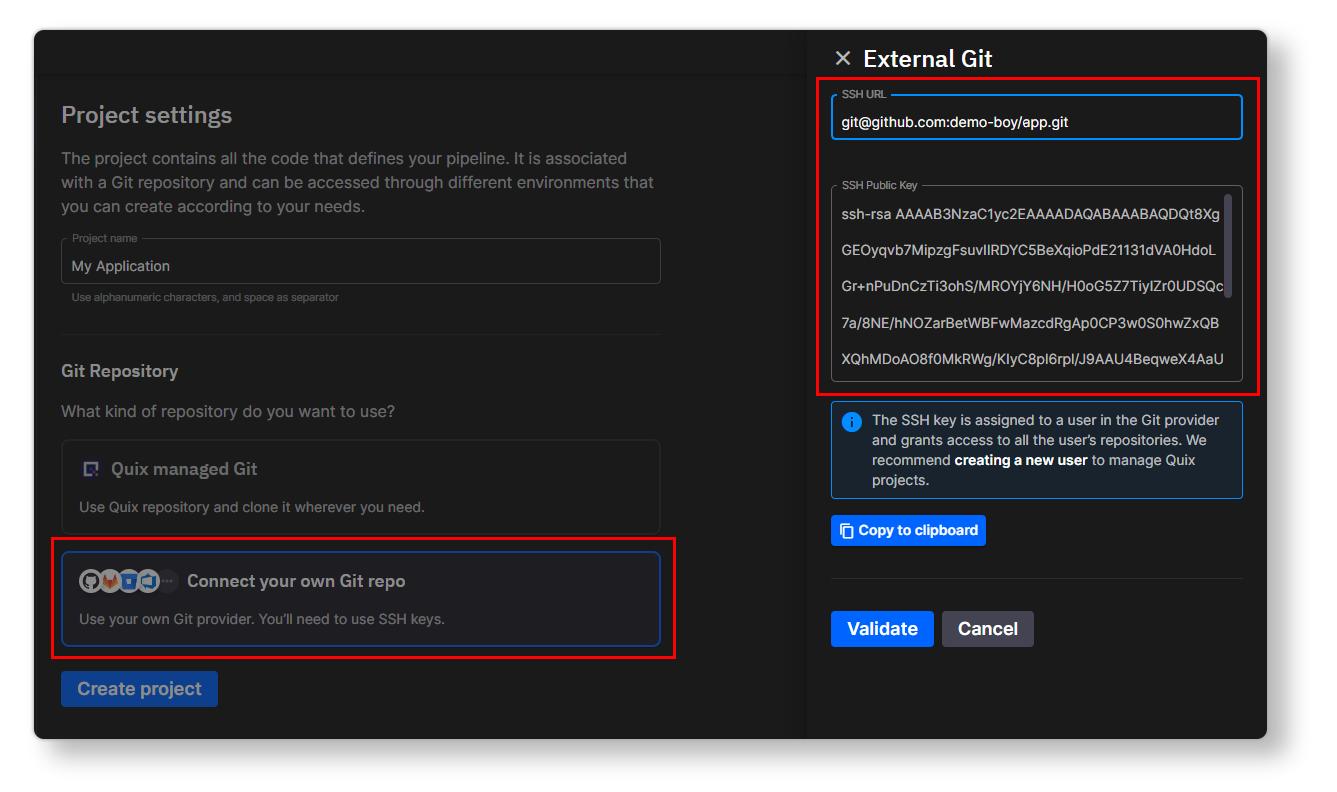
Name your project “My computer vision demo” (or something similar) and select Connect to your own Git repo.
-
On the next screen, you should see some instructions on how to add the Quix SSH key to your repo—follow those instructions. Adding this key enables Quix to automatically synchronize the your repo with the Quix environment
-
On the next screen, you’ll be asked to create an environment—environments enable you to deploy code from different branches in parallel.
Enter ‘
tutorial’ for the environment name and select the ‘tutorial‘ branch from your forked repo.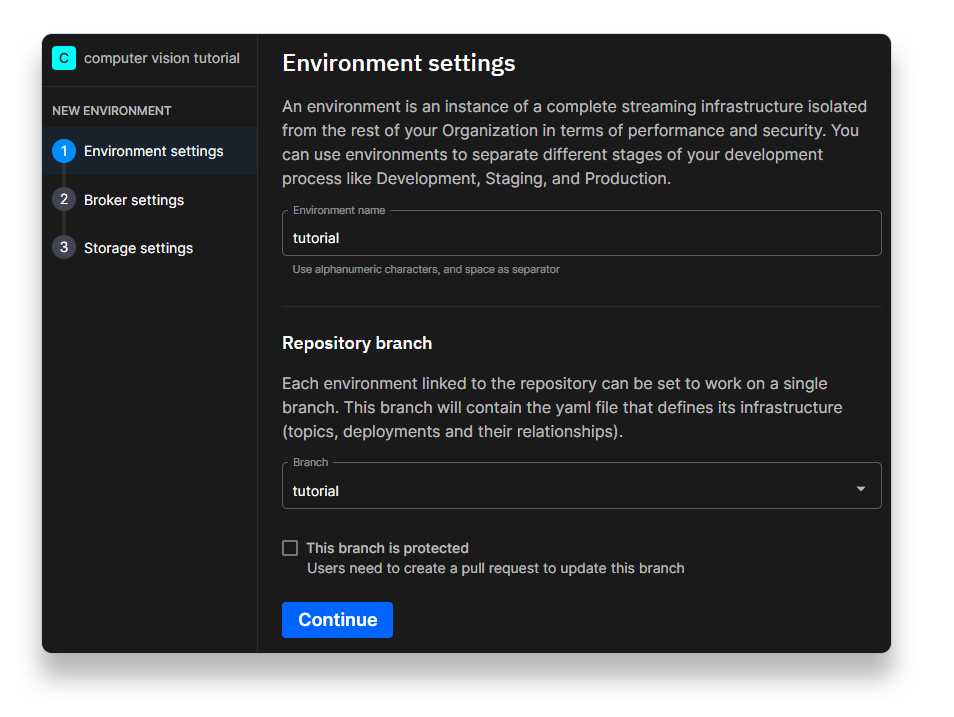
-
Continue through the next steps in the project creation wizard.
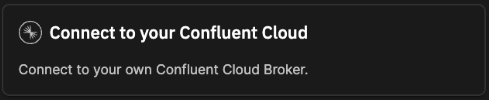
The wizard will ask you which message broker you want to use. The original version of the project uses Confluent Cloud as a message broker. If you want to use Confluent Cloud, you’ll need to have an account first—in which case you would the select Connect to your Confluent Cloud and enter your credentials.
However, it’s not compulsory to use Confluent Cloud. For this tutorial, you can also stick with the default Quix message broker.
-
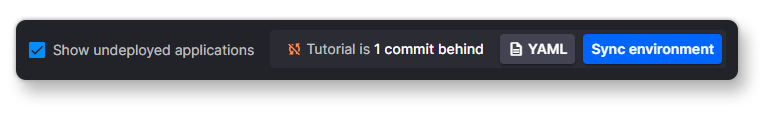
Once you have completed the wizard, navigate to the Pipeline page (if it’s not open already). You'll see a standard warning that your Quix environment is out of sync with the source repository (since the environment starts empty).
-
Click the Sync environment button to pull the latest code from your forked repo. Note: the sync process is bidirectional, so if you change some code within your environment, it will push it back to the source repo too.
Hopefully the sync was successful. If it worked, you should see all your services start to build on the Pipeline page.
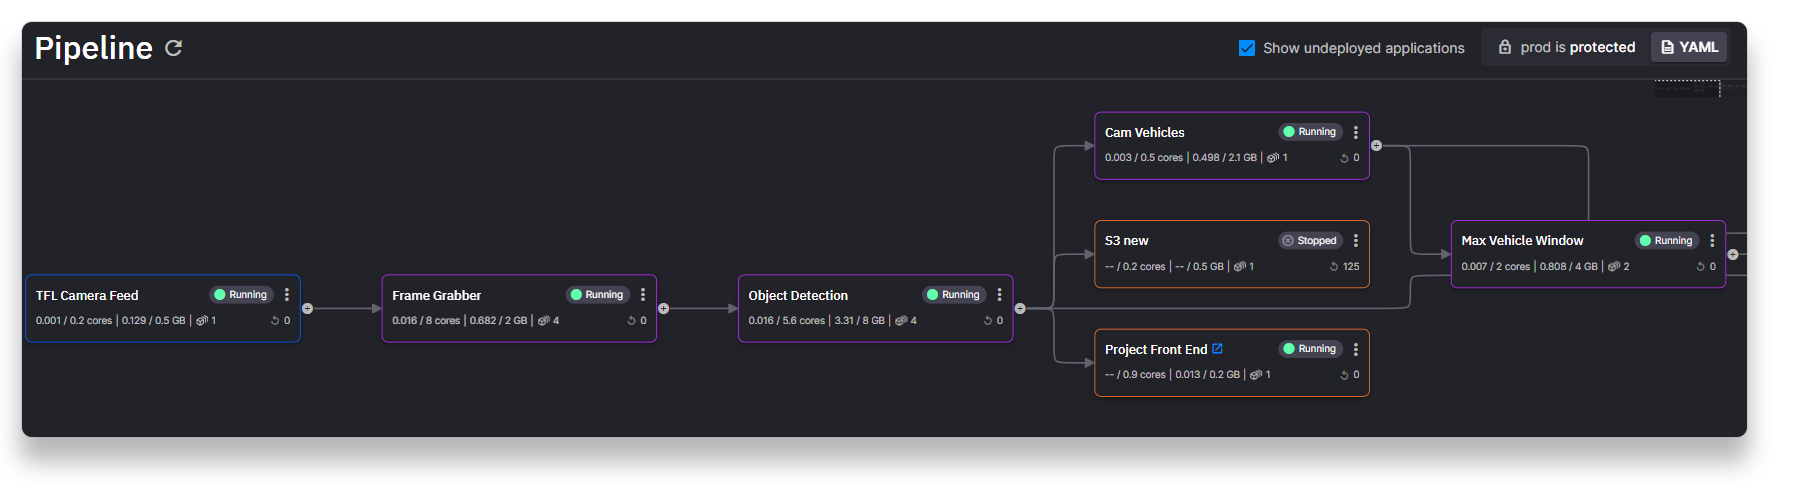 There are quite a few services, so it will take a few minutes for all the services to build and start running.
Note, the S3 service is stopped by default because you’ll need your own AWS account to get that one working. But it’s not really necessary for this tutorial anyway.
-
To see the full pipeline on the Pipeline page, click and drag anywhere on a blank part of the canvas and scroll to the right, or hold down Ctrl / ⌘ and use your mouse wheel to zoom out.
-
Scroll until you can see a service called “Project Front End”.
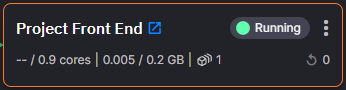
-
Click the blue launch icon next to the “Project Front End” service name.
You now should see your very own copy of the computer vision app, ready to play around with.
Understanding the architecture of the computer vision demo app
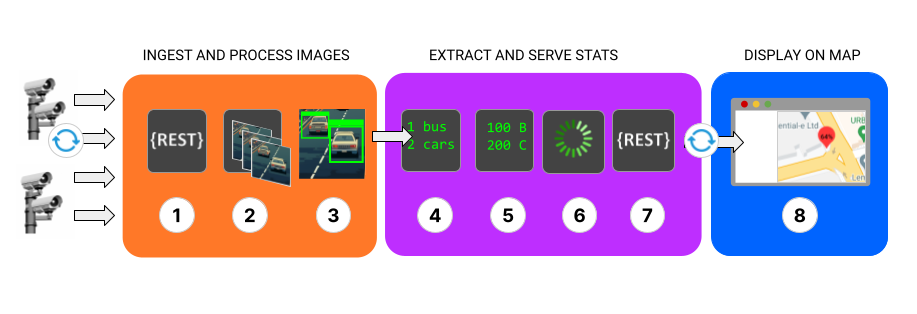
The pipeline consists of many services, but the architecture can be abstracted down into three main segments as illustrated in the following diagram:
-
The first set of services (1-3) taps into London's traffic cameras, identifying vehicles on each monitored road segment.
-
The second set of services (4-7) keep a running total of the vehicle types at each road segment, and log the maximum number of vehicles that were detected in a given frame. This data is then buffered and passed to a REST API service so that data is accessible to any external service that wants to request it..
-
The final service (8), hosts a front end which polls a REST API for aggregated vehicle statistics and listens on a Websocket for live raw data from all of the traffic cameras (such video frames) which comes from a topic in Quix. This combination of polled and real-time data is used to visualize traffic levels on a map of London.
I won't go into too much detail about the specifics of the individual services because the documentation does a good job of that already. But if you want to take a look at how they work, here is some reference information with links to the documentation.
Service Reference
If you click the service name you can see the actual service running in a Quix read-only environment, including the runtime logs and data lineage.
|
Service Name |
Description |
|---|---|
|
Retrieves the camera feeds from the TfL API endpoint, using a TfL API key and the “requests” Python library. |
|
|
Extracts frames from the video files provided by the Tfl API. Documentation, Source code |
|
|
Takes frames from the frame grabber and detects objects in each frame. |
|
|
Calculates the total vehicles. |
|
|
Calculates the maximum vehicles over a time window of one day. |
|
|
The data buffer provides a one second data buffer to reduce load on the Data API service. |
|
|
A REST API service that provides two endpoints. Documentation, Source code |
|
|
Hosts a front end which checks the API for new data. Documentation, Source code |
What I want to focus on here is showing you how to customize the project to your own requirements.
Customizing the project
To help you customize the project, I’ll show you how to make a small change to the aggregation logic in the back end and render that new information in the front end.
After that, I’ll point you to some external resources that will help you perform more powerful tasks such as vehicle counting and object tracking. But first we need to do a bit of admin, such as adding fresh application secrets.
Adding your own API credentials and updating the secrets
The project template is configured with some default credentials but you’ll need to change them to get your copy of the project to work. You’ll need to define each of these credentials as a secret in your project. The secrets are as follows.
-
A bearer token for the front end to communicate with the SignalR hub in Quix (secret key: ‘
bearerToken’) -
Your Tfl API key (secret key: ‘
tfl_api_key’)
Configuring a bearer token for the Front End
The front end uses the SignalR client library to communicate with Quix (via a Websockets API) to retrieve and render data from the back end. This API requires a bearer token to authenticate client applications.
For this tutorial, you’ll create a Quix personal access token to use as your bearer token. You’ll then create a secret to store this token in your environment (yes, this is a bit convoluted, but you only have to do it once).
#Getting a personal access token
Here’s how you get a personal access token in Quix.
-
Open your profile menu on the top-right, and select Personal Access Tokens.

-
In the dialog that appears, click Generate token and paste your personal access token in notepad or any other temporary storage location—you’ll need it for the next step.
Adding your personal access token to the secrets
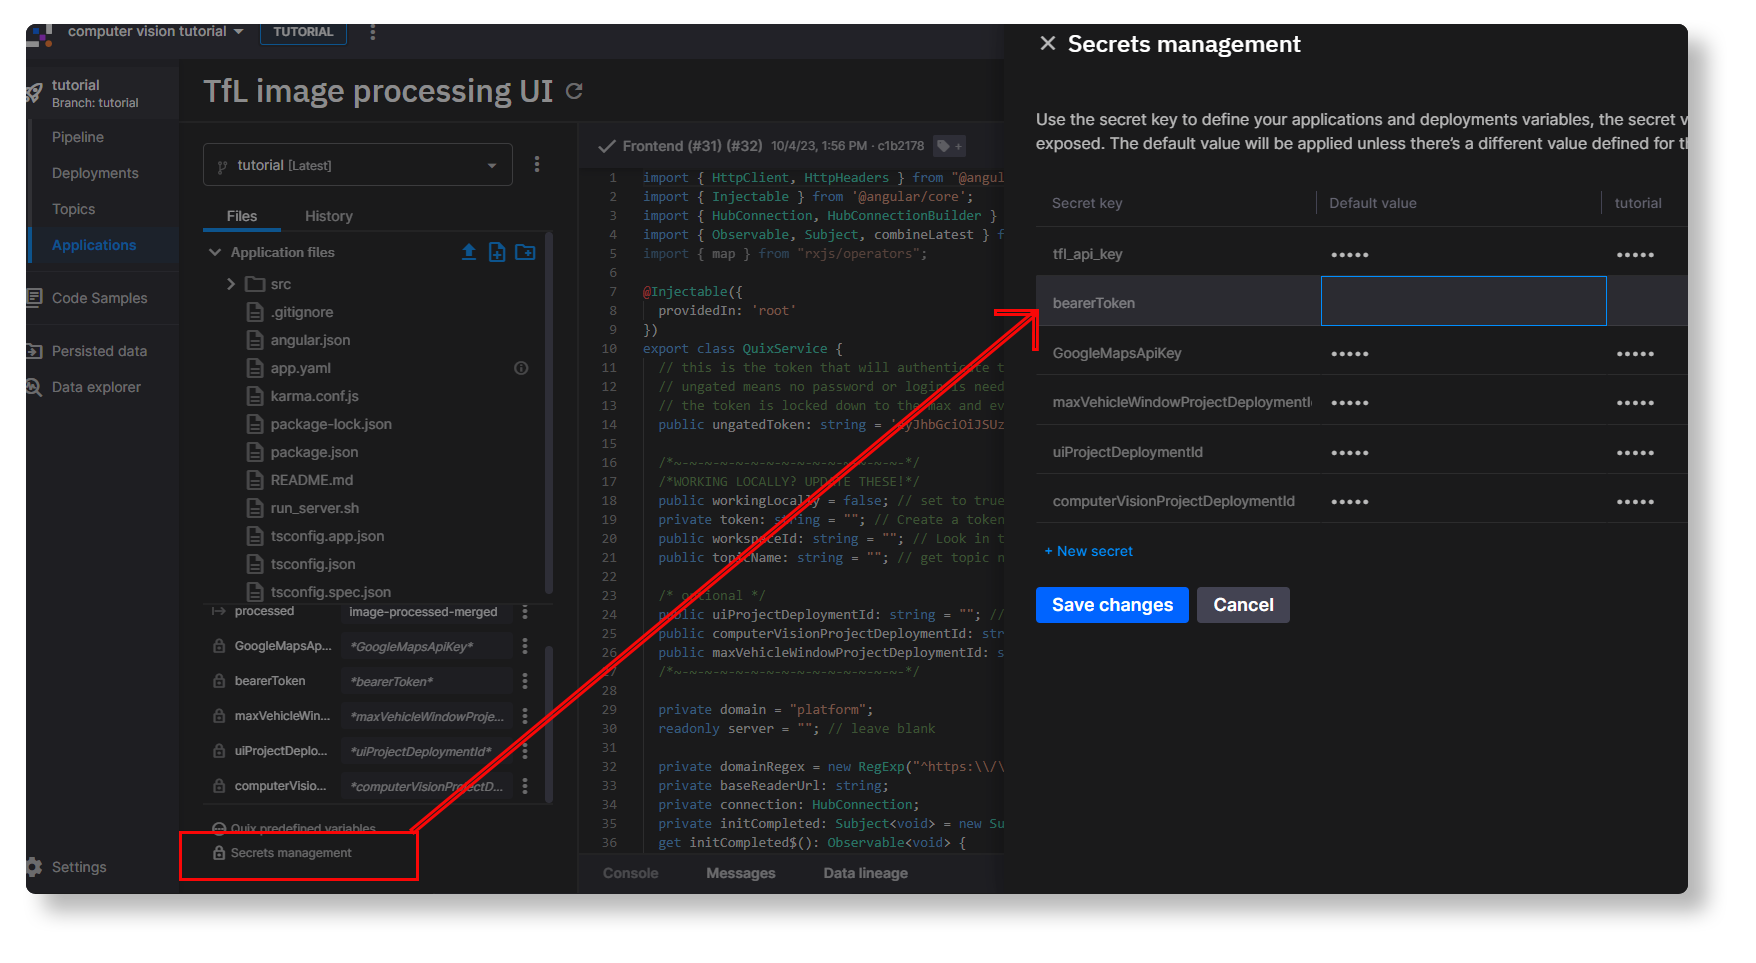
In the Quix portal, open the Applications page and click Sentiment Demo UI to open the Quix IDE.
-
In the Variables section (bottom left), click Secrets management.
-
In the sidebar that appears, click + New secret, and enter “
bearerToken” as the Secret key. -
In the “Default” and “Tutorial” columns, paste your Personal Access Token that you created in the previous step as the value in each cell.
Adding your tfl API key to the secrets
Assuming you have registered with the Tfl API portal you first need to add your own Tfl API key as a secret too.
- To add the secret, need to follow exactly the same steps as the previous section, but this time add a secret with the key ‘
tfl_api_key’.
Updating the back end to get the combined maximum number of vehicles seen throughout London
Right now, you can only see the maximum number of vehicles observed per camera in the last 24 hours. For instance, let's examine the data displayed underneath this video frame taken from the camera at Kings Cross and Swinton Street
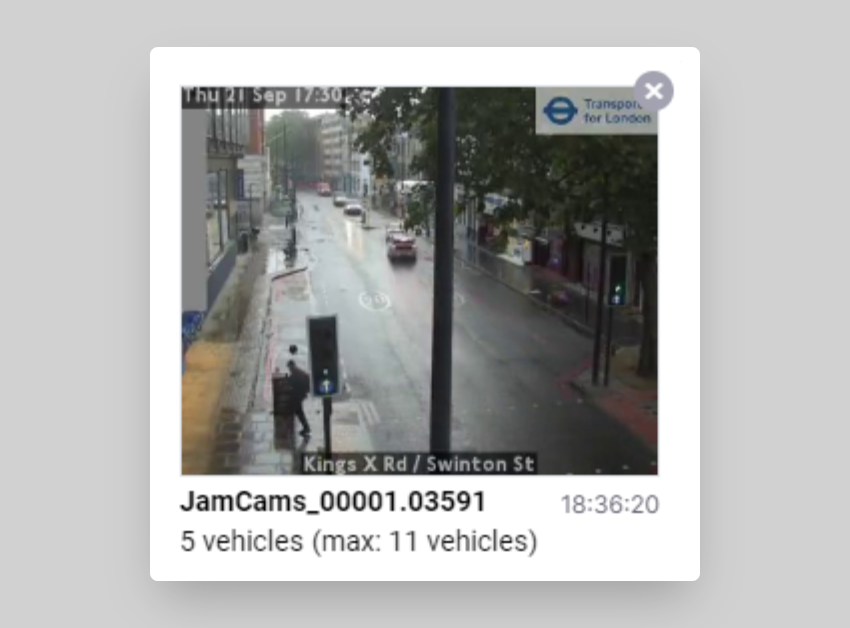
- Currently, it thinks that there are 5 vehicles in the frame.
- However, the most vehicles that the camera has ever observed (in the same frame) is 11 vehicles.
-
We don’t know _when _that cluster of 11 vehicles was observed, just that the observation was made some time in the last 24 hours.
-
But wouldn’t it be interesting to see the same data for all of London? I.e. What’s the combined maximum number of vehicles observed by London's cameras at any one time? And what's the maximum number of buses observed by all cameras?
To answer these questions, we want to end up with data that looks something like this
{"24hmax_vehicles_allcams": 680.0,
 "24hmax_buses_allcams": 131.0,
 "24hmax_cars_allcams": 522.0,
 "24hmax_trucks_allcams": 94.0,
 "24hmax_motorcycles_allcams": 4.0}
Note that we’re not talking about total vehicle counts here (I’ll get to that later), just a snapshot of the most vehicles that London's traffic cameras have observed in the last 24 hours.
To get this data, you’ll need to make the following changes
-
Get the maximums for each vehicle type observed in the last 24 hours (not just all vehicles).
-
Store the latest maximums, aggregate them all (across all cameras).
-
Continuously refresh the aggregation when new maximums are observed by different cameras.
Then, you’re doing to render the data in the front end so that it looks something like this:
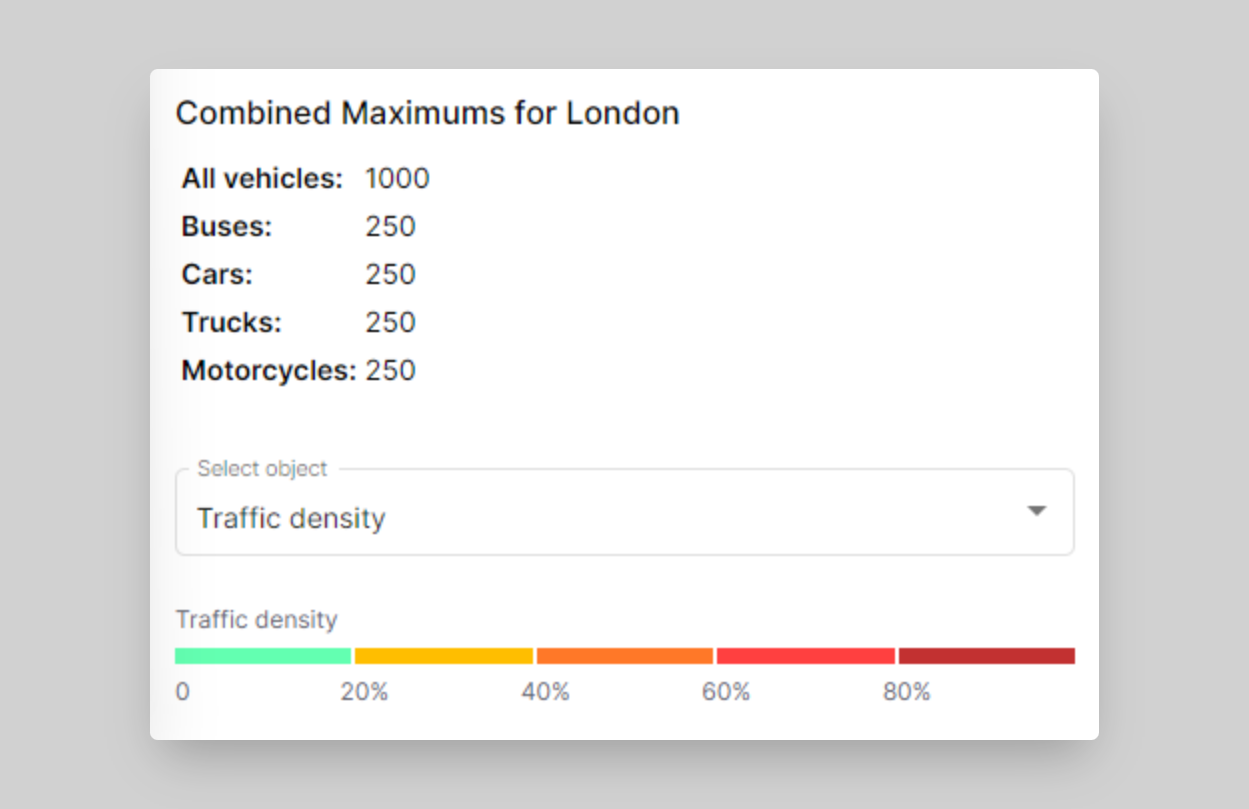
I’ve created some code for this already, but before you test it, you’ll need a place to store the new aggregations as they come in. In this example, I’ll show you how to use a new kafka topic to store the data.
Adding a new “max-vehicles-agg” topic
Not entirely sure what a topic is? The Apache Kafka documentation is a good starting point, but in essence, topics are described as similar to a folder in a filesystem, and the events (in the form of messages) are the files in that folder. You’ll learn how to create one in the Quix UI—which is a very simple process.
To create a topic in the Quix Portal follow these steps:
-
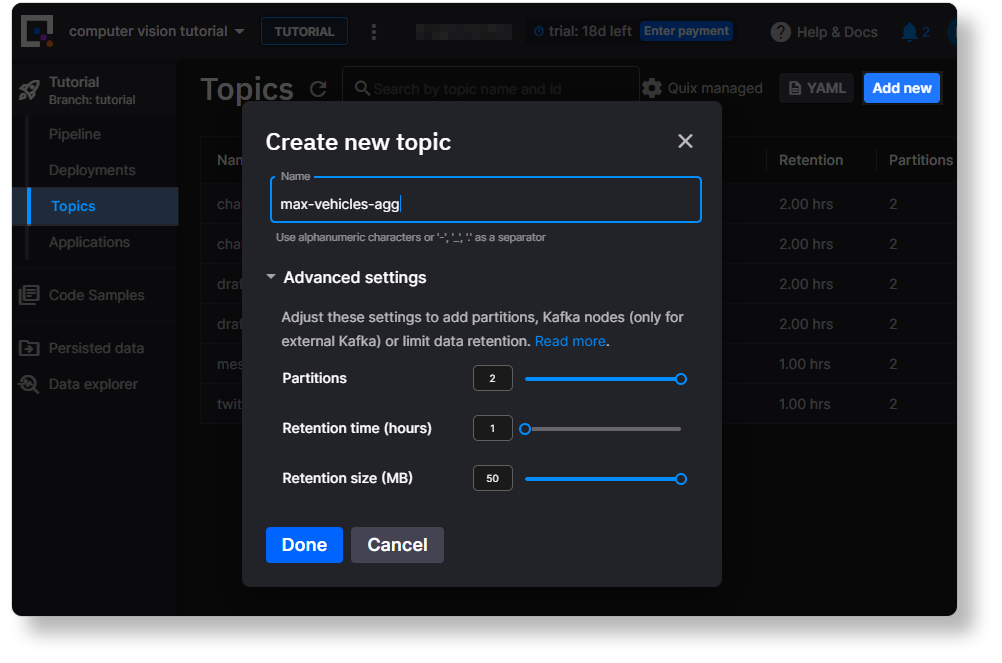
In the Quix Portal, open the Topics page and click Add new in the top right corner.
-
In the dialog that appears, enter a name such as “max-vehicles-agg”, leave the default settings as they are and click Done.
 Now, you’ll need to update the code in the back end to write this topic. The service that you need to change is called “Max Vehicle Window”. It’s a Python service that aggregates data using the Quix Streams and Pandas Python libraries.
When editing services in general, you always have two options.
-
Edit and test your local IDE, then commit and push your changes to your forked repo.
-
Edit and test in the online Quix IDE.
The Quix IDE can be a bit quicker because all the dependencies are installed for you and you don’t have to set up a new virtual environment. It also pushes your changes automatically, which can speed things up a bit. For this example, I’ll use the Quix IDE.
Updating the max vehicles service to aggregate data for all cameras
To save time, I’ve created some code for this already, so all you need to do is paste it into the relevant file.
To edit the Max Vehicle Window service:
-
Navigate to Applications, and click Max Vehicle Window to open the Quix IDE.
Note, in the Quix user interface, the codebase for each service is referred to as an “application” but in reality it’s a self-contained folder that stores the code for a particular service (which all work together to power the computer vision app).
-
If it’s not open already, click
main.pyin the left-hand file menu to open it in the Quix IDE. -
In another window, open this file from our tutorials repo, then copy and paste the code, replacing all of the existing code. The code comments should help you understand what changes I made.
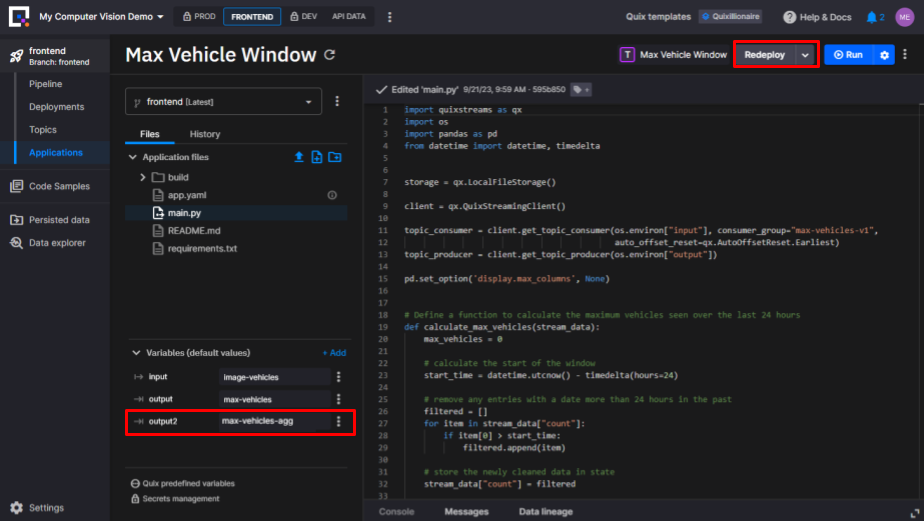
The new code is expecting there to be a new environment variable called “output2” which stores the name of the new output topic you created previously, so let’s create that new variable.
- In the Variables section, click +Add to add a new environment variable,
- In the dialog that appears, select Output Topic as the variable type, name the variable “output2” and select the topic you created as the default value (e.g. “max-vehicles-agg”)
Now, you just need to save and deploy your changes.
-
To save your changes, click Commit.
-
Before you redeploy, it’s a good idea to tag the revision so that it’s easy to tell what version of the code the deployment is using.
-
Tag the commit by clicking the tag icon and give it a name… something like “NewAggregation”.
-
If you want to double check that the new code works, click Run in the top-right.
-
-
To redeploy the service, open the deployment dropdown on the top right, and select “Edit existing deployment” then click “Redeploy”.
To inspect the topic, open the Quix Portal, navigate to the Topics page and click the “max-vehicles-agg” topic you created before.
-
Each topic has a view called the “data explorer view” which lets you inspect the messages flowing through a topic.
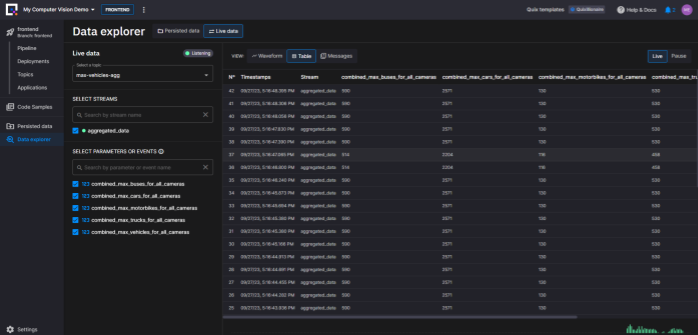
You should now see an active stream in the “SELECT STREAMS” section.
-
Select the stream “aggregated_data” (or whatever it happens to be called)
-
Then select all the available parameters in the SELECT PARAMETERS… section.
-
Finally, select the Table view so you can see your selected data.
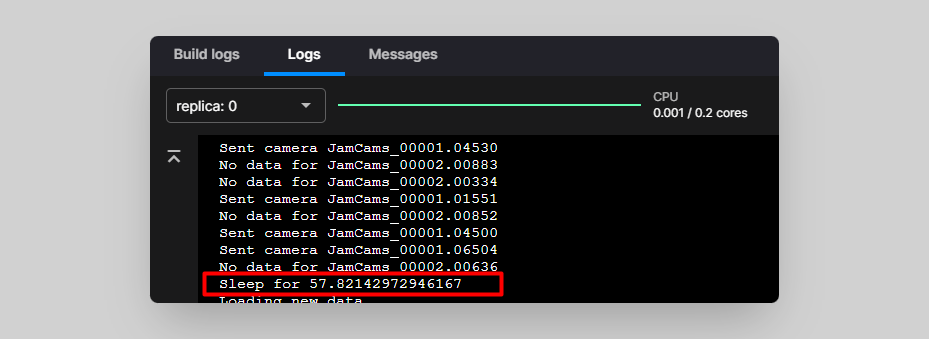
Note that new data might not come through straight away because the TFL Camera Feed service has a variable sleep timer to avoid hitting the rate limits of the TfL API. You can configure it in the “sleep_interval” environment variable. At the time of writing, it was set to default to 60 seconds.
If you inspect the logs of the TFL Camera Feed deployment, you should see when this timer has been activated. When you see data coming through again, it’s safe to go back and check your topic
Updating the front end to display the map and the new aggregations
If you’re bothered about changing the front end code, you can skip this part. Quix is mainly a back end tool but we’ve added a front end component so that you create a fully functional mini application. In this section, you’re going to update the front end to display the aggregations.
Display the new aggregation data in the front end
Now, let's update the UI service to include the new aggregates that we created in the back end. As a reminder, here’s how it should look when you’re done.
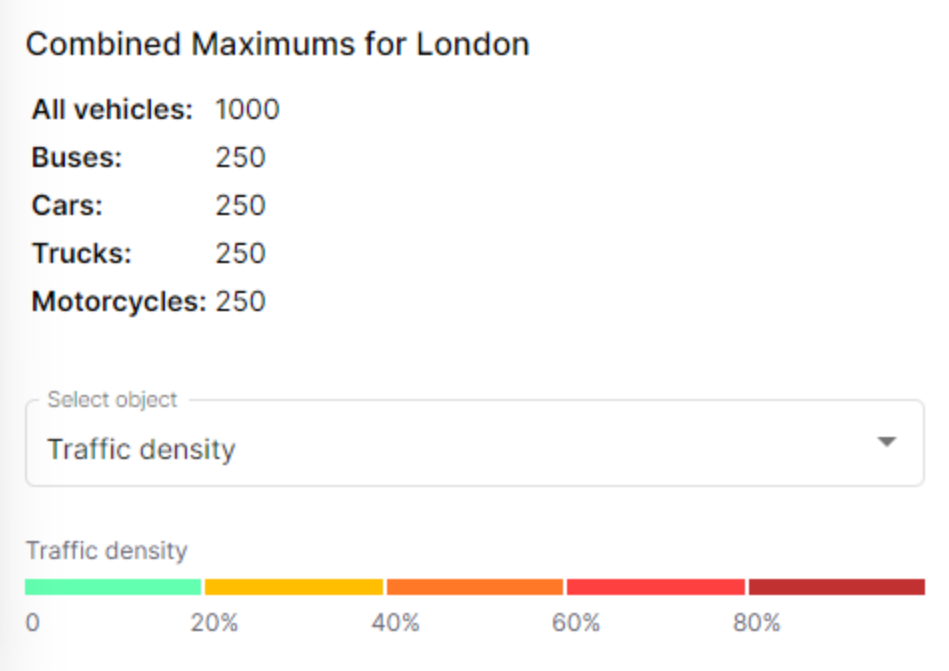
It’s not pretty, but it gives us the info we need. To update the UI, you’ll need to edit the following files:
-
‘
app.component.ts’ which manages the data subscriptions for the front end:<repo_root>/TfL image processing UI/src/app/app.component.ts -
‘
app.component.html’ which defines the layout of information on the page.<repo_root>/TfL image processing UI/src/app/app.component.html
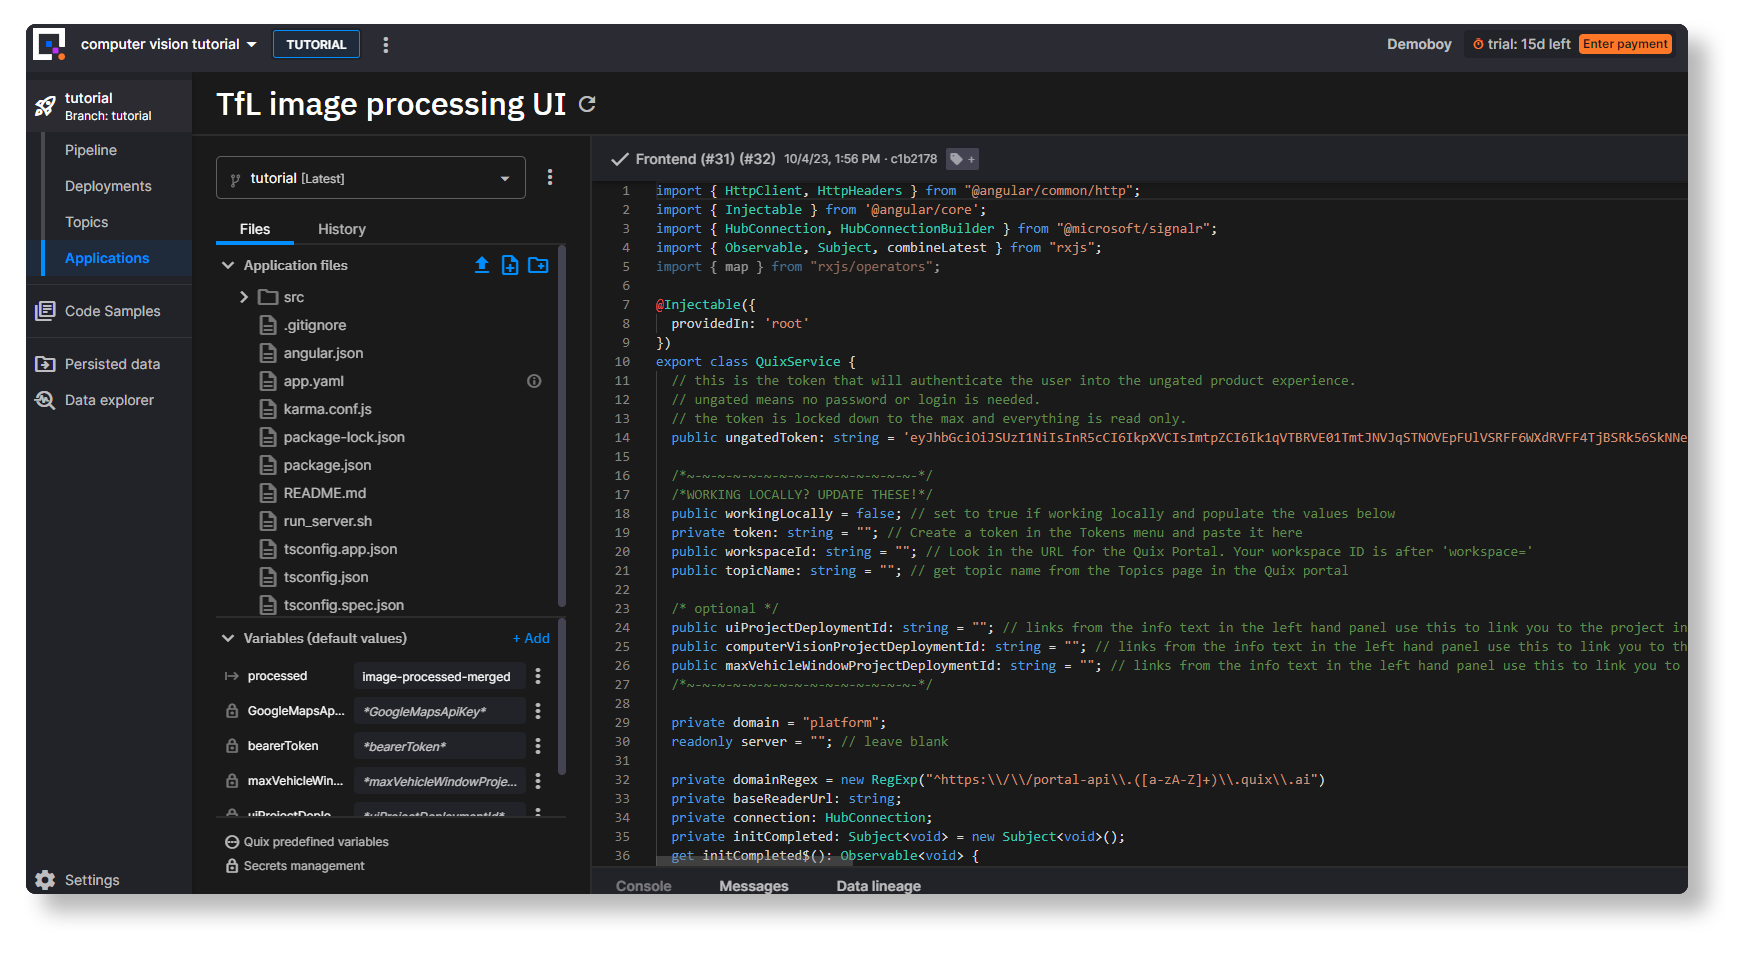
Let’s start with app.component.ts. In the Quix Portal, navigate to Applications, and click TfL image processing UI (deployed as “Project Front End”) to open the Quix IDE.
 Updating the data subscriptions
Here, we’re going to be a bit hacky and hard-code the topic references. In production this should be handled with variables, but it makes the demo simpler.
In the Application files section, open ./src/app/app.component.ts.
Locate the following block (after line 213):
subscribeToData() {
  this.connection.invoke('SubscribeToParameter', this._topicName, this._streamId, 'image');
  this.connection.invoke('SubscribeToParameter', this._topicName, this._streamId, 'lat');
  this.connection.invoke('SubscribeToParameter', this._topicName, this._streamId, 'lon');
  this.connection.invoke('SubscribeToParameter', 'max-vehicles', '*', 'max_vehicles');
  this.connection.invoke('SubscribeToParameter', 'image-vehicles', '*', '*');
And the following extra line underneath the block:
this.connection.invoke('SubscribeToParameter', 'max-vehicles-agg', '*', '*'); // new line
This will initiate a subscription to the topic and read all the parameters in the message (parameterData is a specific data type in the Quix API and It is typically composed of numeric data.)
Next, locate the line 'selectedMarker: Marker | undefined;’ (line 43 or thereabouts) and add the following new line underneath it.
latestMessageMaxAgg: ParameterData | undefined;
This line initializes a new variable that you’ll use to store the data from the messages.
Now, let's assign the data to the variable whenever a new message is detected.
First, locate the following block (after line 108):
if (data.topicName === "image-vehicles") {
    key = data.streamId;
    if (data.numericValues['vehicles']) markerData.count = data.numericValues['vehicles'][0];
    if (data.numericValues[this.parameterId]) markerData.value = data.numericValues[this.parameterId][0];
          }
Add the following block underneath it:
 if (data.topicName === 'max-vehicles-agg') {
     this.latestMessageMaxAgg = data;
     }
Now, if the message comes from a topic called ‘max-vehicles-agg’, the front end will take all the data in the message and put it in the variable latestMessageMaxAgg.
Now that we have access to the variable, let’s render its contents in the front end.
Updating the front end template
Now, it’s time to finally render the data that we’ve made available to the front end.
- In the Application files section, open
./src/app/app.component.html.
Locate the following div that renders a colored traffic density scale (after line 85):
<div>
    <p class="mat-caption text-body mb-1">Traffic density</p>
Directly above it, add the following code block.
<div *ngIf="latestMessageMaxAgg">
<h4 _ngcontent-kap-c49="" class="mb-2">Combined Maximums Across All London Cameras</h4>
    <table>
    <tbody>
    <tr><td><strong>All vehicles:</strong></td>
      <td>
        {{ latestMessageMaxAgg?.numericValues?.['combined_max_vehicles_for_all_cameras']?.at(0) }}
      </td>
    </tr>
    <tr><td><strong>Cars:</strong></td>
      <td>
        {{ latestMessageMaxAgg?.numericValues?.['combined_max_cars_for_all_cameras']?.at(0) }}
      </td>
    </tr>
    <tr><td><strong>Buses:</strong></td>
      <td>
        {{ latestMessageMaxAgg?.numericValues?.['combined_max_buses_for_all_cameras']?.at(0) }}
      </td>
    </tr>
    <tr><td><strong>Trucks:</strong></td>
      <td>
        {{ latestMessageMaxAgg?.numericValues?.['combined_max_trucks_for_all_cameras']?.at(0) }}
      </td>
    </tr>
    <tr><td><strong>Motorcycles:</strong></td>
      <td>
        {{ latestMessageMaxAgg?.numericValues?.['combined_max_motorbikes_for_all_cameras']?.at(0) }}
      </td>
    </tr>
    </tbody>
    </table>
</div>
This extracts data from the latestMessageMaxAgg variable you created earlier and displays the data from the most recent message (selected via “at(0)” ). It also makes the data optional so that you don’t get an error message data is missing.
If you want to test it on your local machine first, you can pull the changes you made in the Quix IDE (Quix pushes them automatically) and follow the instructions in the front end service README.
-
To redeploy the TfL image processing UI service, follow the same process that you did when redeploying the max vehicles service.
If anything goes wrong, remember that you might have to delete the service and deploy it again before you can see error output in the logs.
Counting vehicles over longer time periods
As you’re probably noticed, the app is not actually counting vehicles over time, rather just counting the number of vehicles observed in any given video frame.
This is because we’re not using the full capabilities of YOLOv8. We are just using object detection, but to count vehicles properly, you’ll need to use object tracking. The problem is, object tracking requires more memory, which is not available in the Quix free plan. This demo uses the smallest “nano” YOLO model, but there are four other sizes available, with YOLOv8x being the most powerful. If you use a larger model, you can get great results for vehicle tracking and counting.
Here’s a screenshot from an attempt to run it on my local machine (with a decent GPU) on a TfL camera feed.
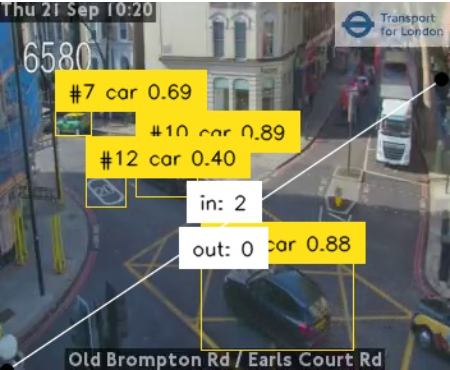
I used YOLO in combination with a couple of other libraries (such as supervision from Roboflow) to count vehicles going both directions along the road.
For more information about how to get similar results, see the following resources:
-
Track and Count Objects Using YOLOv8 (roboflow.com)
An excellent primer on vehicle counting using computer vision using a Jupyter Notebook.
-
YOLOv8 Object Detection & Counting | by Dustin Liu | Sep, 2023 | DataDrivenInvestor
A walkthrough of an optimized Streamlit version of the Roboflow Notebook (discussed in the previously linked article)—you can also try it out online.
Conclusion
Kudos for making it this far. I hope you were able to successfully customize it. If you had any issues, be sure to post a question in our community forum and one of us will get right on to it.
As you can see, it’s fairly simple to deploy and run complex applications in Quix. These demos are designed to be self-contained, so we host the front end too. In a production scenario however, you’d probably want to run your front end somewhere else. What Quix really excels at is processing event streams and performing complex computations in an extremely performant way. It leverages the strengths of Apache Kafka to process data at scale while abstracting away some of its weaknesses (such as resource management and configuration complexity). Of course, if you have your own Kafka instance already, or are using Confluent Cloud, you can use that too. Quix is there to help you orchestrate and process your event streams in real time.
- To learn more about how Quix environments are managed in Quix, check out the relevant section in the Quix documentation.
- To see another full functional demo app, why try out our chat app demo which uses the Hugging Face Transformers library to perform live sentiment analysis on chat messages.
By Tomáš Neubauer (CTO and Co-Founder of Quix)
Also published here.
[story continues]
tags