TL;DR —
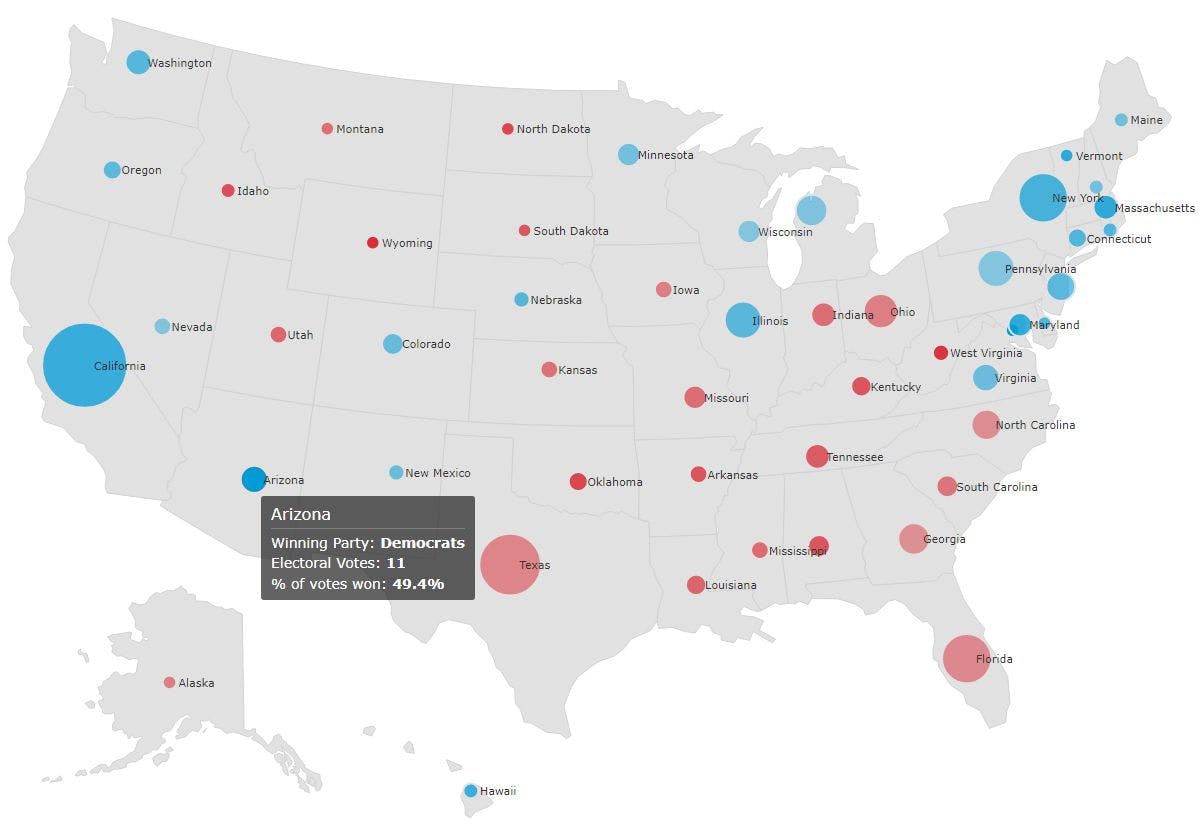
How to Create a Bubble Map with JavaScript to Visualize Election Results. Shachee Swadia is a Data Designer and Content Creator. She uses AnyChart JavaScript Library to create bubble maps along with this tutorial. A bubble map is essentially a combination of a bubble chart and a map where the bubbles are plotted over geographical regions. The size of the bubble indicates the value of the particular variable, with the position on the map indicating location. The number of electoral votes for each state, by the bubble size, and the bubble color.
[story continues]
Written by
@visualscribbler
Visualiser. Writer. Coder.
Bibliophile. Globetrotter. Ambivert.
Hopeful Humanist. Hopeless Optimist. Happy Soul.
Topics and
tags
tags
javascript|data-visualization|visualization|charts|data-science|usa-2020-election|data-analysis|programming|web-monetization
This story on HackerNoon has a decentralized backup on Sia.
Transaction ID: MkWjNAQwLS9I35SbL54TBfs36OCg5sB6_XCwuehfwFM