In modern observability stacks, log-based alerts are often more immediate and actionable than those based on metrics - especially when you're tracking down anomalies, security incidents, or sudden application failures. While tools like Loki simplify log aggregation, turning those logs into meaningful, automated alerts remains a challenge.
In the world of metrics, many engineers are familiar with Prometheus and its PrometheusRule resource for Kubernetes. But what if you could apply that same flexible, declarative alerting model to Loki logs?
In this article, we’ll explore how to use Grafana Alloy together with the PrometheusRule resource to dynamically generate alerting rules for Loki, bringing powerful, rule-based alerting to your logs. In Kubernetes environments, this approach bridges the gap between logs and metrics, enabling you to manage Loki log alerts with the same PrometheusRule resource streamlining alert configuration.
Let’s get started!
Problem in the wild
The PrometheusRule Custom Resource Definition (CRD) is the de facto standard for managing alerting rules in the Prometheus ecosystem. It’s supported by many tools, including Grafana Alloy, Thanos, and others. However, it wasn't originally designed to handle alerts based on Loki logs. This is unfortunate, as Loki alerting rules share the same structure - the only difference lies in the expressions, which use
Over time, some community members attempted to extend this pattern by introducing custom resources like LokiRule and GlobalLokiRule. However,
The AlertingRule and RecordingRule resources, but they only work if Loki is deployed via the operator. If you installed Loki using another method - such as the very popular
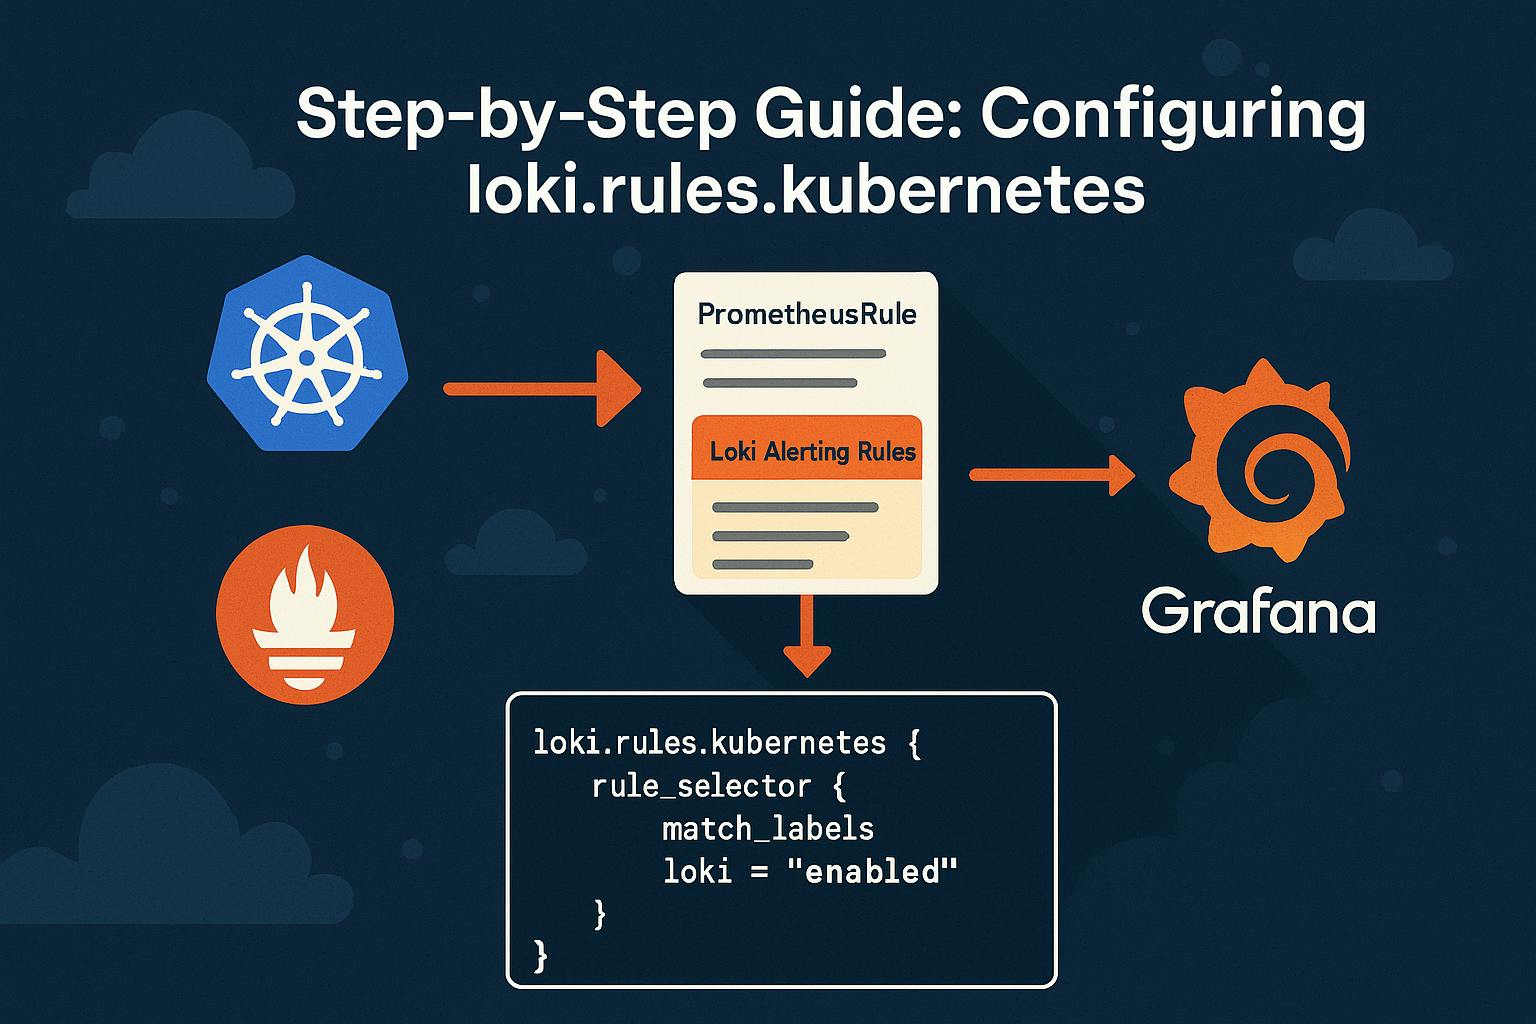
Fortunately, Grafana Alloy (formerly Grafana Agent) offers a way forward. It supports a special configuration block loki.rules.kubernetes, which allows you to define Loki alerting rules using standard PrometheusRule CRDs. This bridges the gap, but it doesn’t work out-of-the-box. Due to sparse documentation and required extra configuration, it can be tricky to set up. We’ll walk through the necessary steps in this article.
Step-by-step guide to configure loki.rules.kubernetes
This guide assumes that Loki and Grafana Alloy are already deployed and running in your Kubernetes cluster.
Step I: Add loki.rules.kubernetes to Grafana Alloy configuration
To enable Loki alerting rules, configure Alloy to look for PrometheusRule resources that are intended for Loki:
loki.rules.kubernetes "kvendingoldo_demo" {
  address    = "http://loki-ruler.loki.svc.cluster.local:3100"
  tenant_id  = "17"
   rule_selector {
    match_labels = {
      loki = "enabled"
    }
  }
}
This block tells Grafana Alloy to scan for PrometheusRule resources labeled with loki=enabled. You can use any label of your choice - just be consistent throughout the configuration.
Notes:
- This configuration alone is not sufficient. If you try to apply a
PrometheusRulecontaining a Loki-specific expression at this stage, it will be rejected by the Prometheus Admission Webhook due to failed expression validation. - Don’t forget to update the Loki
addressandtenant_idto match your environment. - If you're also using
mimir.rules.kubernetes to forward rules to Mimir, make sure to exclude any Loki-specific rules from being sent there. Since Loki uses LogQL instead ofPromQL , Mimir won't be able to parse them correctly and will throw errors. Snippet example:
mimir.rules.kubernetes "kvendingoldo_demo" {

  ...

  rule_selector {
    match_expression {
      key      = "loki"
      operator = "DoesNotExist"
    }
  }
}
Step II: Configure Prometheus admission webhook to skip Loki rules validation
By default, the Prometheus Operator validates all PrometheusRule objects using PromQL. Since Loki alerting rules use LogQL, this validation will fail unless explicitly bypassed. To avoid this, configure the admission webhook in the Prometheus Operator to skip validation for rules labeled for Loki:
admissionWebhooks:
  matchConditions:
    # Skip PrometheusRule validation when the "loki" label is present
    - name: ignore-loki-rules
      expression: '!("loki" in object.metadata.labels)'
This rule tells the admission webhook: If the loki label is present on a PrometheusRule, skip validating its expressions.
This is essential to prevent validation failures when applying rules that contain LogQL queries.
Notes:
- Make sure your
PrometheusRuleCustom Resource Definition (CRD) is up-to-date. - If you're using the
kube-prometheus-stack Helm chart, you’ll need at least version75.3.6to use thematchConditionsfield inadmissionWebhooks.
Step III: Configure the Loki ruler
To support dynamic alerting rules, additional configuration is required for the Ruler component:
- Enable persistence: This is required to store and manage dynamically loaded rules.
- Use S3 (or any other object storage) for ruler storage: The default
localstorage backend does not support dynamic rules, as the file system is typically read-only in container environments. - Enable the ruler API: This allows Loki to receive rule definitions dynamically — e.g., from Alloy via CRDs.
loki:
…
 rulerConfig:
   enable_api: true
   storage:
     type: s3
     s3:
       s3: "<YOUR_BUCKET_URL>"
       s3forcepathstyle: true
       insecure: true
…
ruler:
…
 persistence:
   enabled: true
Notes:
Once the logging stack is configured with persistence and API access, Loki will expose endpoints for dynamically loading alerting rules, whether they originate from:
- Mounted YAML files
- Kubernetes ConfigMaps
PrometheusRuleCRDs via Grafana Alloy
To learn more, check
Step IV: Create a PrometheusRule resource
Once everything is wired up, you can define log-based alerting rules using PrometheusRule CRD - even though they use LogQL instead of PromQL.
Here's an example of PrometheusRule alert that triggers when Grafana Alloy generates over 100 log lines per minute, sustained for 10 minutes:
---
apiVersion: monitoring.coreos.com/v1
kind: PrometheusRule
metadata:
 name: kvendingoldo_demo
 labels:
   loki: enabled
spec:
 groups:
   - name: AlloyPrometheusRuleTest
     rules:
       - alert: AlloyLogLineCount
         expr: count_over_time({namespace="grafana", container="alloy"}[1m]) > 100
         for: 10m
         labels:
           severity: warn
         annotations:
           summary: Grafana Alloy is logging more than usual
Step V: Verify that everything works
First of all, create a Kubernetes pod that continuously emits logs. The pod message is designed to be matched exactly by the alert rule.
---
apiVersion: v1
kind: Pod
metadata:
  name: kvendingoldo-log-generator
  labels:
    app: kvendingoldo-log-generator
spec:
  containers:
  - name: logger
    image: busybox
    command:
    - /bin/sh
    - -c
    - >
      while true; do
        echo "how-to-create-loki-alerts-kvendingoldo-article";
        sleep 10;
      done
Define a PrometheusRule that will trigger if the log line appears more than once per minute:
---
apiVersion: monitoring.coreos.com/v1
kind: PrometheusRule
metadata:
 name: kvendingoldo-loki-log-alerts
 labels:
   loki: enabled
spec:
 groups:
 - name: log-generator-alerts
   rules:
   - alert: ErrorLogsDetected
     expr: |
       sum by(pod) (
         count_over_time(
           {app="kvendingoldo-log-generator"} |= "how-to-create-loki-alerts-kvendingoldo-article"
           [1m]
         )
       ) > 1
     for: 1m
     labels:
       severity: warning
     annotations:
       summary: "High error rate in kvendingoldo-log-generator pod"
       description: "More than one error log in the past minute from pod {{ $labels.pod }}"
This rule:
- Uses LogQL to look for specific messages in logs from the pod.
- Triggers if more than one such log is seen within a minute.
- Waits for 1 minute before firing the alert (
for: 1m).
Finally, it’s time to verify that the rule has been loaded and alerting is functioning correctly.
Open the Grafana UI, then navigate to: Alerts → Alert Rules
You should see the log-generator-alerts rule listed. If the pod has generated enough matching logs, the alert will show as Firing. Otherwise it will be Normal.
This confirms that:
- The rule was successfully picked up by the Loki Ruler via Grafana Alloy.
- Loki is evaluating the rule based on real-time log data.
Final thoughts
By combining Kubernetes-native PrometheusRule CRDs with label selectors and the loki.rules.kubernetes block in Grafana Alloy, you get a powerful and flexible way to manage log-based alerts within your cluster. This allows enables you to:
- Dynamically provision alerts via K8S resources.
- Keep all alerting rules CRD-managed, version-controlled, and Kubernetes-native
- Leverage full LogQL to catch everything from simple errors to complex log patterns
- Centralize all alerts — logs and metrics — in a single Grafana interface
In short, this setup brings together the best of DevOps and observability: automated, scalable, and fully integrated log alerting, all within your Kubernetes ecosystem.