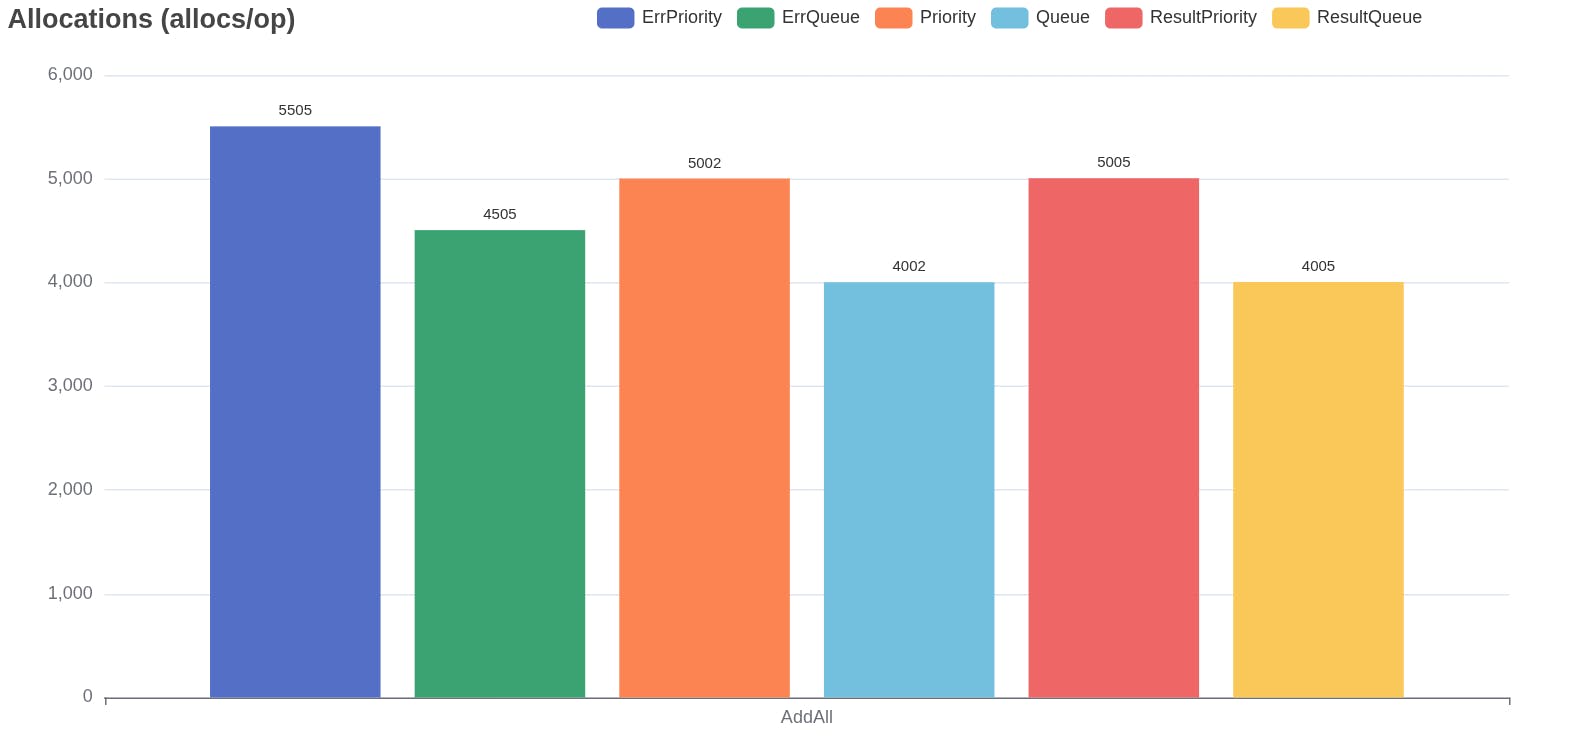
Benchmarking in Go is straightforward, but visualizing those results? That's where things get messy. When you're comparing different libraries or implementations across various workloads, staring at raw benchmark numbers just doesn't cut it.
I found myself in this exact situation while working with my message queue library, varmq. I needed to compare performance across different scenarios, but existing visualization tools either didn't exist or didn't fit my needs.
So I built Vizb – a CLI tool that transforms Go benchmark results into beautiful, interactive HTML charts with a single command.
The Magic is in the Simplicity
go test -bench . -run=^$ -json | vizb -o output.html
That's it. One command, and you get:
- Interactive HTML charts showing execution time, memory usage, and allocations
- Responsive design that works on any device
- Export capability – download charts as PNG images directly from your browser
- Smart grouping that automatically organizes your benchmarks by workload and subject
Key Features That Actually Matter
Multiple Metrics in One View: Compare execution time, memory usage, and allocation counts side by side.
Customizable Units: Display metrics in your preferred units (ns/μs/ms/s for time, B/KB/MB/GB for memory).
Flexible Input: Works with files or piped input – whatever fits your workflow.
JSON Output: Need the data in a different format? Use --format json to get structured data instead of HTML.
Real-World Example
Here's how Vizb automatically groups your benchmarks. If you have:
BenchmarkEncoder/small/json
BenchmarkEncoder/small/msgpack
BenchmarkEncoder/large/json
BenchmarkEncoder/large/msgpack
Vizb creates charts where:
- Test: Encoder
- Workloads: small, large
- Subjects: json, msgpack
The result? Clean, organized charts that make performance differences immediately obvious.
Why It Matters
When you're optimizing code or choosing between libraries, you need insights, not raw numbers. Vizb turns your benchmark data into actionable visualizations that help you make better decisions faster.
Check it out: github.com/goptics/vizb
Check out the live chart benchmarks: varmq-benchmark
Install it with: go install github.com/goptics/vizb
Happy benchmarking! 🚀
[story continues]
tags
