Table of Links
-
Methods
-
Results
3 Results
3.1 Neutral Density Filter Experiment
A total of 20 healthy participants were scanned at a 6x6 mm disc scan using Solix SD-OCT for the NDF experiment. With 7 optical densities levels, no filter and NDF with 0.1~0.6 optical density, we gathered a total of 140 scans from 20 participants. The average age and axial length were 35.4±8.0 years and 25.0±1.3 mm, respectively. Twenty percent participants were female.
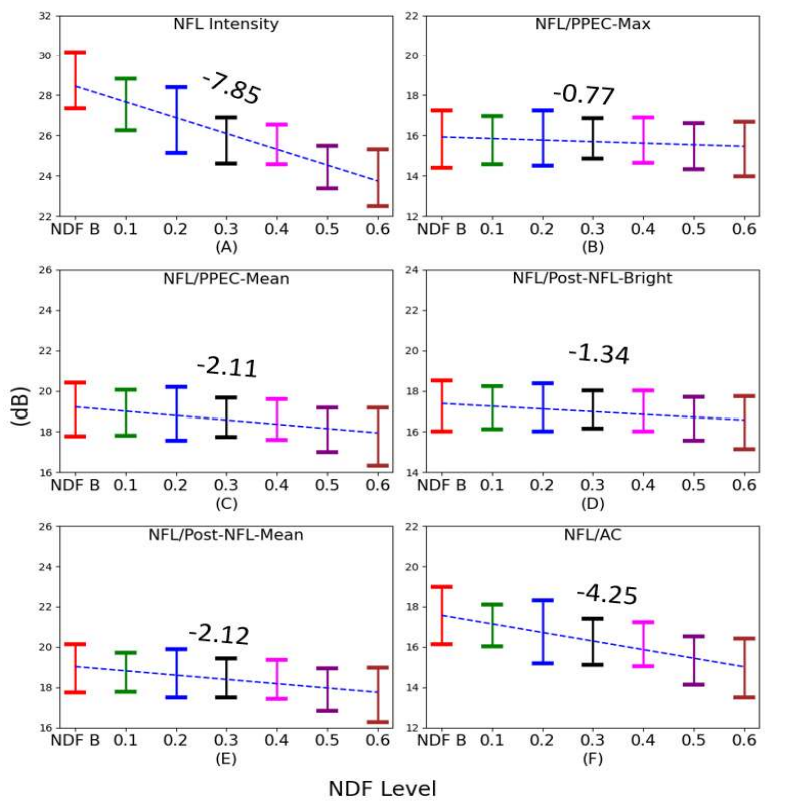
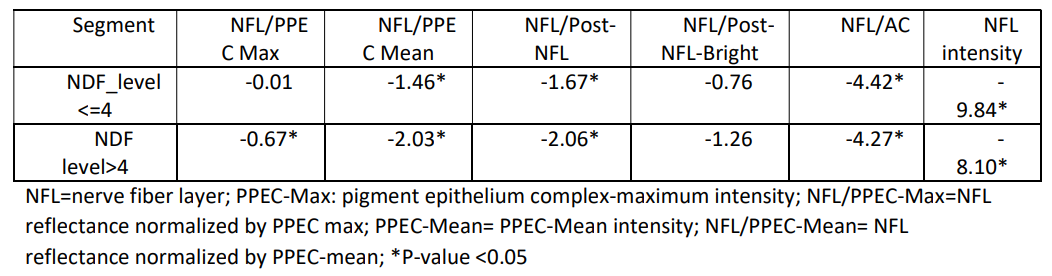
We observed slopes slightly changed when the NDF level>=0.4 in figure 2. So we evaluated the difference of slope between two segments using a broken stick model with a break-point at NDF level =0.4 optical density (Table 1). The difference of slopes between two segments were significant (p<0.05) for normalized NFL reflectance using different sub-retinal layers, but not significant for the NFL reflectance without reference or the summation of NFL attenuation coefficients. The signal strength index (SSI) of scans was is 48.55±5.57 at NDF level=0.4. This indicated we should still choose a slight larger than 49 as a cutoff of image quality for NFL reflectance analysis after we used a reference layer to compensate the shadowing artefacts.
3.2 FSOCT Clinic Data Analysis
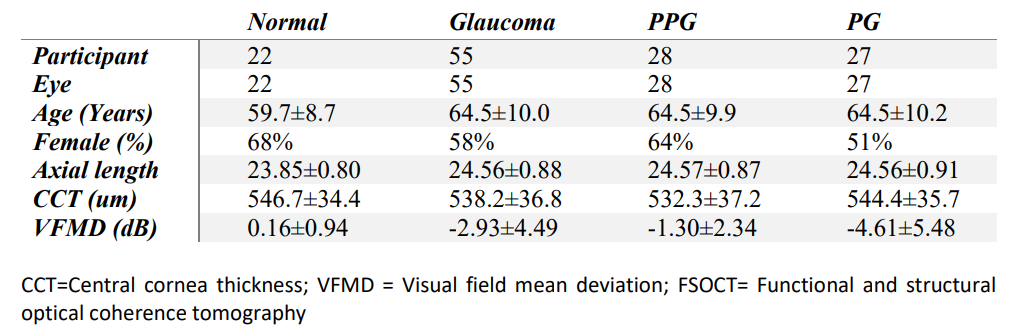
Following the rules in selecting eyes with two visits and qualified repeated scans in each visit, we selected 22 normal eyes of 22 participants and 55 glaucoma eyes of 55 participants from FSOCT study (Table 2). Out of glaucoma eyes, 28 eyes were PPG and 27 were PG. The average ages were 58±10 years and 64±10 years and for normal and glaucoma participants (p<0.05, T-test), respectively. Females were 59% among all eyes (p==0.45, fisher's exact test) according fisher. The axial lengths were 23.8±1.0 mm for normal participants and 24.6±1.1 for glaucoma eyes (p<0.05, T-test).
We evaluated the associations of NFL reflectance with gender, age, axial length and SSI for different normalized NFL reflectance using univariate linear regression. To keep the data independent from the normal eyes used in later process, we select the 20 normal eyes in NDF experiment (scans without NDF) and 19 normal eyes in FSOCT study which did have the second visits. For all normalized NFL reflectance metrics, only age and SSI were significantly associated with NFL reflectance (p=0.01 for age & p<0.001 for SSI). Although SSIs were significantly associated with normalized NFL reflectance metrics, we didn't adjust NFL reflectance using the SSI in later process since the SSI was related to NFL intensity and therefore contained diagnostics information. The later analysis was done with normalized NFL reflectance metrics adjusted by age only.
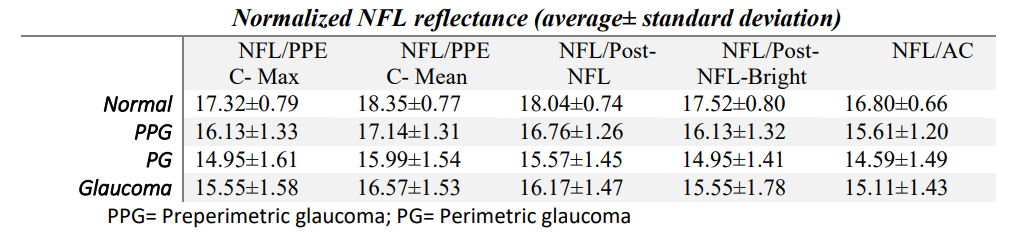
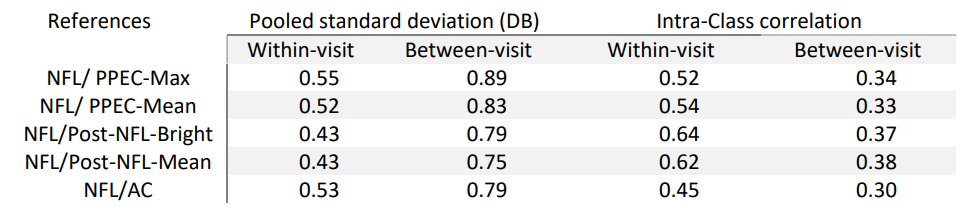
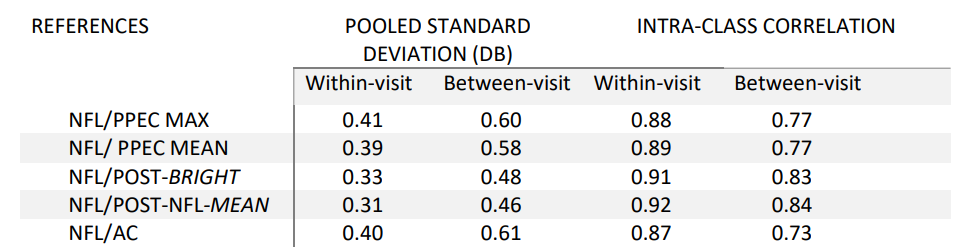
All normalized NFL reflectance metrics reduced with increasing glaucoma severity (Table 3). Normal eyes had significantly higher NFL reflectance than PPG, PG, or glaucomatous eyes (p<0.01). NFL/post-NFL-Mean and NFL/post-NFL-Bright had the best within-visit and between-visit repeatability (table 4 and 5). The pooled SD for this two metrics was 20-25% smaller than other metrics. But the difference are not significant (only 28/3 comparisons were significant). We also noticed a trend of increasing repeatability and reproducibility with more subretinal layers in the reference layer. However, this trend did not apply to the NFL/AC, which used all pixels below NFL for compensation but had similar ICC and pooled SD as the NFL reflectance normalized by PPEC-max. The low repeatability of NFL/AC may be due to that the signal noise ratio behind Bruch membrane is worse than SNR in sub-retinal layers in spectral domain OCT.
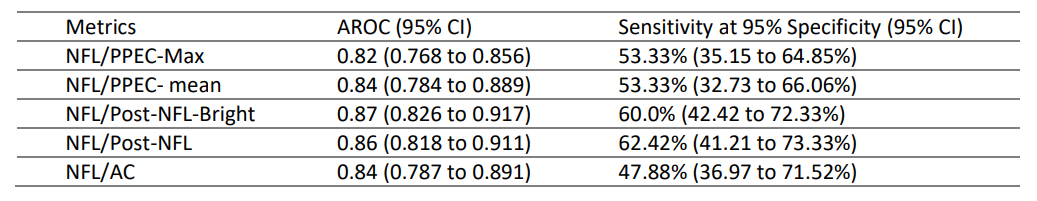
The diagnostic accuracy of all normalized NFL reflectance were similar (AROC=0.82~0.87, and Sensitivity at 95% specificity: 47.88% to 53.33%). However, Post-NFL-Bright provide the best diagnostic accuracy, where the NFL/PPEC-Max is significantly lower than NFL/Post-NFL-Bright (p<0.05).
4 Discussion
As per the experimental results, NFL/PPEC Max is better in each NDF level followed by the Post-NFLBright, PPEC/Mean, Post-NFL-Mean and NFL/AC. We also observed more layers give better repeatability since it can reduce variation in the same person. For instance, NFL/Post-NFL-Mean and NFL/Post-NFL-Bright were used more layers below NFL and hence provide better repeatability and reproducibility that ultimately increase diagnostic accuracy.
The NFL/AC provides the lowest result in both NDF and ICC even though it has more layers, it might be the layer below PPEC contains more noise which affects the NFL/AC.
All of the reference metrics provide quite similar diagnostics accuracy (0.82-0.87), where NFL/Post-NFLBright provide the best result while the remaining were very competitive. It could be noted that each reference except NFL/AC provides better compensation till optical density 0.3, which is equivalent to image quality level 49.
Although the Post-NFL-Mean band offers better repeatability in FSOCT, it compensates poorly at each NDF level. This could be attributed to the presence of a darker layer in this band. To address this issue, we utilized the Post-NFL band and selected the top 50% of pixels, creating a new band called Post-NFLBright. By doing so, we were able to reduce the dependence on global attenuation after PPEC-Max. Thus the Post-NFL-Bright is more reliable reference since it perform well in both FSOCT and NDF dataset.
5 Conclusions
NFL reflectance corrected by NFL/PPEC-Max and NFL/Post-NFL-Bright provides better compensation in NDF datasets, while the summation of attenuation coefficients gave worse results. NFL/Post-NFL-Mean and NFL/Post-NFL-Bright showed better repeatability and diagnostics accuracy in FSOCT datasets. Overall NFL/Post-NFL-Bright is more reliable since it works well in both NDF and FSOCT datasets.
Author Contributions
O.T. and D.H. designed the study. O.T. and D. H. wrote the manuscript and all coauthors critically commented and/or edited the manuscript. D.H. supervised the project. L.L. and Q.Y. did the manual grading. J.W. and Y.L. developed the Center for Ophthalmic Optics & Lasers-Angiography Reading Toolkit (COOL-ART) software. A.C, E, I and J.M. conduct the clinical study.
Competing Interests Statement
OHSU, Dr. Tan, Dr. Huang, and Dr. Jia have a significant financial interest in Optovue, Inc., a company that may have a commercial interest in the results of this research and technology. These potential conflicts of interest has been reviewed and managed by OHSU.
References
-
Jordan Dwelle, Shuang Liu, Bingqing Wang, Austin McElroy, Derek Ho, Mia K. Markey, Thomas Milner, H. Grady Rylander; Thickness, Phase Retardation, Birefringence, and Reflectance of the Retinal Nerve Fiber Layer in Normal and Glaucomatous Non-Human Primates. Invest. Ophthalmol. Vis. Sci. 2012;53(8):4380-4395. doi: https://doi.org/10.1167/iovs.11-9130.
-
Ou Tan, Liang Liu, Qisheng You, Jie Wang, Aiyin Chen, Eliesa Ing, John C. Morrison, Yali Jia, David Huang; Focal Loss Analysis of Nerve Fiber Layer Reflectance for Glaucoma Diagnosis. Trans. Vis. Sci. Tech. 2021;10(6):9. doi: https://doi.org/10.1167/tvst.10.6.9.
-
Huang XR, Knighton RW, Feuer WJ, Qiao J. Retinal nerve fiber layer reflectometry must consider directional reflectance. Biomed Opt Express. 2015 Dec 4;7(1):22-33. doi: 10.1364/BOE.7.000022. PMID: 26819814; PMCID: PMC4722906.
-
K. A. Vermeer, J. van der Schoot, H. G. Lemij, and J. F. de Boer "Quantitative RNFL attenuation coefficient measurements by RPE-normalized OCT data", Proc. SPIE 8209, Ophthalmic Technologies XXII, 82090U (9 March 012); https://doi.org/10.1117/12.907764
-
Stuart K. Gardiner, Shaban Demirel, Juan Reynaud, Brad Fortune; Changes in Retinal Nerve Fiber Layer Reflectance Intensity as a Predictor of Functional Progression in Glaucoma. Invest. Ophthalmol. Vis. Sci. 2016;57(3):1221-1227. doi: https://doi.org/10.1167/iovs.15-18788.
-
Josine van der Schoot, Koenraad A. Vermeer, Johannes F. de Boer, Hans G. Lemij; The Effect of Glaucoma on the Optical Attenuation Coefficient of the Retinal Nerve Fiber Layer in Spectral Domain Optical Coherence Tomography Images. Invest. Ophthalmol. Vis. Sci. 2012;53(4):2424-2430. doi: https://doi.org/10.1167/iovs.11-8436.
-
K. A. Vermeer, J. Mo, J. J. A. Weda, H. G. Lemij, and J. F. de Boer, "Depth-resolved model-based reconstruction of attenuation coefficients in optical coherence tomography," Biomed. Opt. Express 5, 322-337 (2014)
-
Koenraad A. Vermeer, Josine van der Schoot, Hans G. Lemij, Johannes F. de Boer; RPE-Normalized RNFL Attenuation Coefficient Maps Derived from Volumetric OCT Imaging for Glaucoma Assessment. Invest. Ophthalmol. Vis. Sci. 2012;53(10):6102-6108. doi: https://doi.org/10.1167/iovs.12-9933.
-
Mwanza, Jean C. MD, PhD; Bhorade, Anjali M. MD; Sekhon, Navneet MD; McSoley, John J. OD; Yoo, Sonia H. MD; Feuer, William J. MS; Budenz, Donald L. MD, MPH. Effect of Cataract and its Removal on Signal Strength and Peripapillary Retinal Nerve Fiber Layer Optical Coherence Tomography Measurements. Journal of Glaucoma 20(1):p 37-43, January 2011. | DOI: 10.1097/IJG.0b013e3181ccb93b
Authors:
(1) Kabir Hossain, PhD, Casey Eye Institute, Oregon Health & Science University;
(2) Ou Tan, PhD, Casey Eye Institute, Oregon Health & Science University;
(3) Po-Han Yeh, Casey Eye Institute, Oregon Health & Science University;
(4) Jie Wang, Casey Eye Institute, Oregon Health & Science University;
(5) Elizabeth White, Casey Eye Institute, Oregon Health & Science University;
(6) Dongseok Choi, Casey Eye Institute, Oregon Health & Science University;
(7) David Huang, Casey Eye Institute, Oregon Health & Science University.
This paper is
[story continues]
tags