If you’re not familiar with how cold start works within the context of AWS Lambda, then read this post first.
When a Node.js Lambda function cold starts, a number of things happen:
- the Lambda service has to find a server with enough capacity to host the new container
- the new container is initialized
- the Node.js runtime is initialized
- your handler module is initialized, which includes initializing any global variables and functions you declare outside the handler function
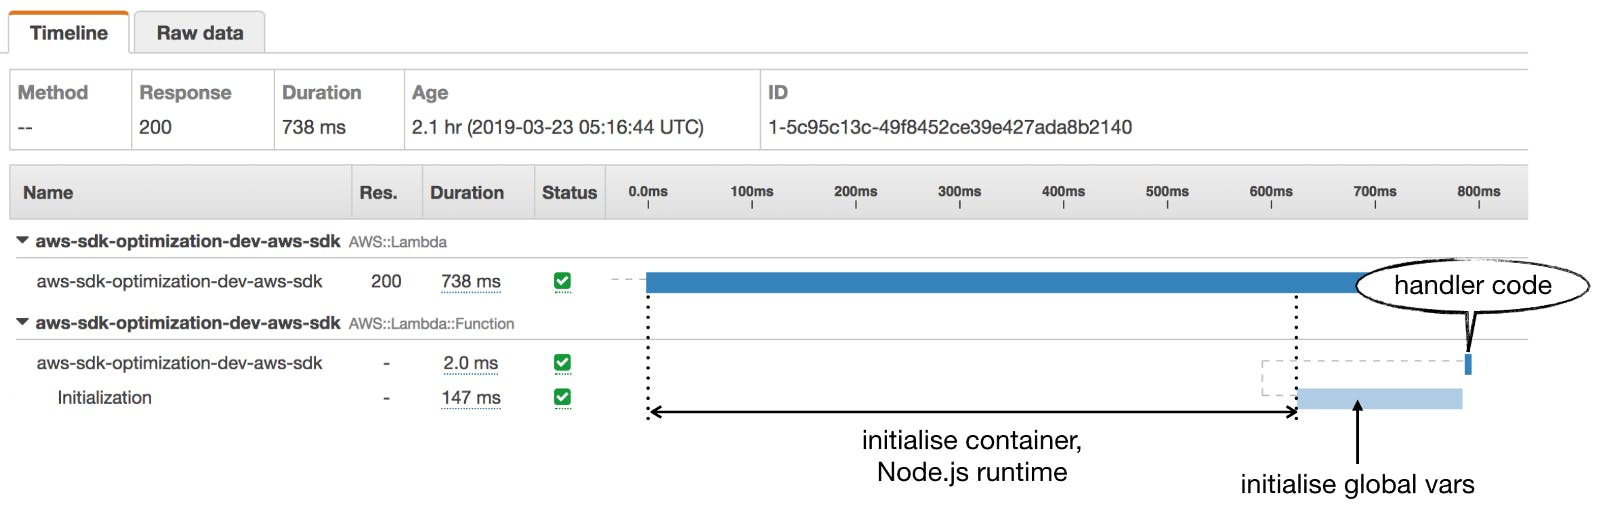
If you enable active tracing for a Lambda function, you will be able to see how much time is spent on these steps in X-Ray. Unfortunately, the time it takes to initialize the container and the Node.js runtime are not recorded as segments. But you can work out from the difference in durations.
Here, Initialization refers to the time it takes to initialize the handler module.
The above trace is for the function below, which requires the AWS SDK and nothing else. As you can see, this simple require added 147ms to the cold start.
const AWS = require('aws-sdk')module.exports.handler = async () => {}
Consider this the cost of doing business when your function needs to interact with AWS resources. But, if you only need to interact with one service (e.g. DynamoDB), you can save some initialization time with this one-liner.
const DynamoDB = require('aws-sdk/clients/dynamodb')const documentClient = new DynamoDB.DocumentClient()
It requires the DynamoDB client directly without initializing the whole AWS SDK. I ran an experiment to see how much cold start time you can save with this simple change.
Credit goes to my colleague Justin Caldicott for piquing my interest and doing a lot of the initial analysis.
In addition to the AWS SDK, we often require the XRay SDK too and use it to auto-instrument the AWS SDK. Unfortunately, the aws-xray-sdk package also has some additional baggages that we don’t need. By default it supports Express.js apps, MySQL and Postgres. If you are only interested in instrumenting the AWS SDK and http/https modules then you only need the aws-xray-sdk-core.
Methodology
I tested a number of configurations:
- no AWS SDK
- requiring only the DynamoDB client
- requiring the full AWS SDK
- requiring the XRay SDK only (no AWS SDK)
- requiring the XRay SDK and instrumenting the AWS SDK
- requiring the XRay SDK Core and instrumenting the AWS SDK
- requiring the XRay SDK Core and instrumenting only the DynamoDB client
Each of these functions are traced by X-Ray. Sample rate set to 100% so we don’t miss anything. We are only interested in the duration of the Initialization segment as it corresponds to the time for initializing these dependencies.
The no AWS SDK case is our control group. We can see how much time each additional dependency adds to our Initialization duration.
To collect a statistically significant sample set of data, I decided to automate the process using Step Functions.
- The state machine takes an input
{ functionName, count }. - The
SetStartTimestep adds the current UTC timestamp to the execution state. This is necessary as we need the start time of the experiment to fetch the relevant traces from X-Ray. - The
Loopstep triggers the desired number of cold starts for the specified function. To trigger cold starts, I programmatically updates an environment variable before invoking the function. That way, I ensure that every invocation is a cold start.
- The
Wait30Secondsstep makes sure that all the traces are published to XRay before we attempt to analyze them. - The
Analyzestep fetches all the relevant traces in XRay and outputs several statistics around theInitializationduration.
Each configuration is tested over 1000 cold starts. Occasionally the XRay traces are incomplete (see below). These incomplete traces are excluded in the Analyze step.
where is the AWS::Lambda:Function segment?
Each configuration is also tested with WebPack as well (using the serverless-webpack plugin). Thanks to Erez Rokah for the suggestion.
The Results
These are the Initialization time for all the test cases.
Key observations:
- WebPack improves the
Initializationtime across the board. - Without any dependencies,
Initializationtime averages only 1.72ms without WebPack and 0.97ms with WebPack. - Adding AWS SDK as the only dependency adds an average of 245ms without WebPack. This is fairly significant. Adding WebPack doesn’t improve things significantly either.
- Requiring only the DynamoDB client (the one-liner change discussed earlier) saves up to 176ms! In 90% of the cases, the saving was over 130ms. With WebPack, the saving is even more dramatic.
- The cost of requiring the XRay SDK is about the same as AWS SDK.
- There’s no statistically significant difference between using the full XRay SDK and XRay SDK Core. With or without WebPack.
Hi, my name is Yan Cui. I’m an AWS Serverless Hero and the author of Production-Ready Serverless. I have run production workload at scale in AWS for nearly 10 years and I have been an architect or principal engineer with a variety of industries ranging from banking, e-commerce, sports streaming to mobile gaming. I currently work as an independent consultant focused on AWS and serverless.
You can contact me via Email, Twitter and LinkedIn.
Check out my new course, Complete Guide to AWS Step Functions.
In this course, we’ll cover everything you need to know to use AWS Step Functions service effectively. Including basic concepts, HTTP and event triggers, activities, design patterns and best practices.
Get your copy here.
Come learn about operational BEST PRACTICES for AWS Lambda: CI/CD, testing & debugging functions locally, logging, monitoring, distributed tracing, canary deployments, config management, authentication & authorization, VPC, security, error handling, and more.
You can also get 40% off the face price with the code ytcui.
Get your copy here.