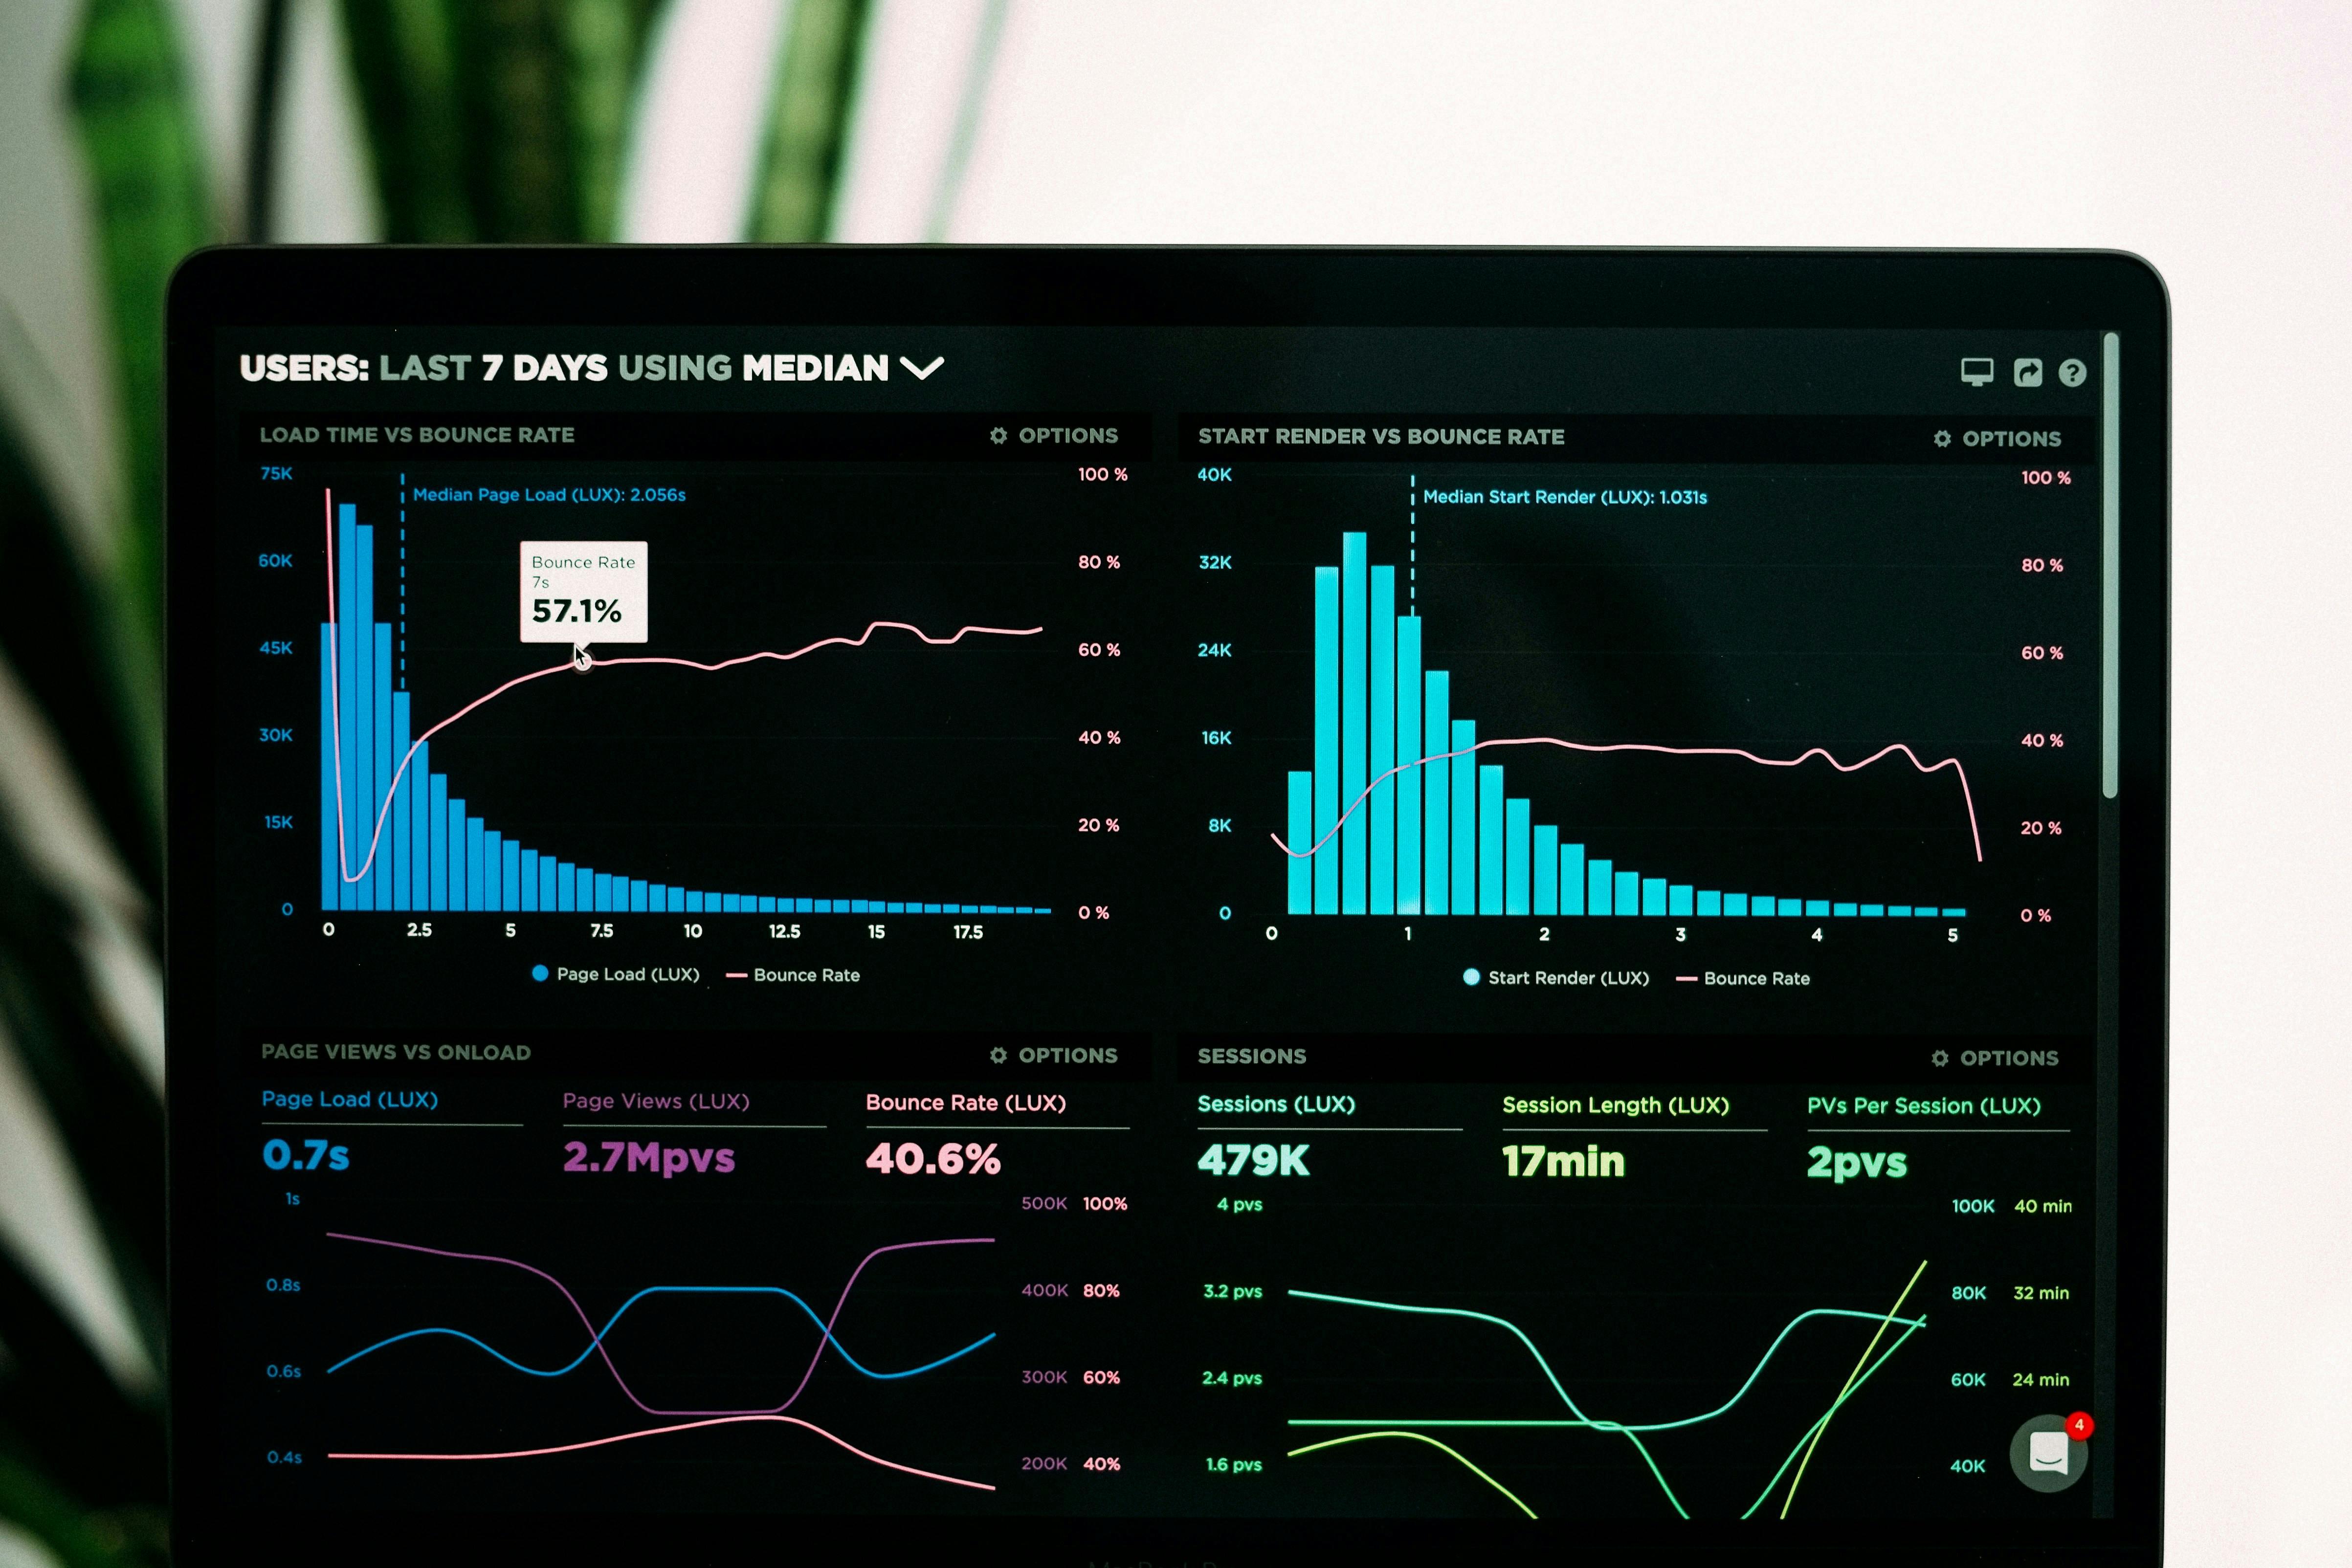
In product management, being able to analyze and also effectively apply data is key. This is just the way it is.
The following pillars and fundamental concepts are important if we want to improve product strategy with data:
- Granularity determines the level of detail in any data analysis, allowing you to make precise adjustments based on your user behavior.
- Distribution shows how data points are spread, as well as highlights trends and anomalies.
- Modeling uses gained insights to predict future trends and guide your decision-making.
Together, these concepts give product managers the tools to make informed decisions that will drive product success.
Granularity and Its Impact on Data Management
Granularity refers to how detailed your data is. Data with high granularity is made of individual records, which gives detailed information, while low granularity means records are compiled into bigger groups like summaries or statistics over longer periods. Collected data ranges from highly detailed specifics, like individual user actions within an application, to broader metrics like monthly usage statistics.
This significantly influences business decisions. For product managers, more granular data gives a very nuanced understanding of user behavior. It pinpoints specific areas for improvement or innovation, and less granular makes data analysis simpler and will probably be enough for broader strategic decisions.
Note: As in every aspect of product development (and life in general) balance is key. Remember the famous YAGNI principle from programming? You Aren't Gonna Need It! applies here too.
I understand wanting to collect as much data as possible for good analysis, but it can be overwhelming for your analysts and managers, which will in turn waste time for your development and data teams. You have to choose the right level of granularity you need because it affects everything from system performance and storage costs to the depth of insights that can be derived. As data granularity increases, so does the complexity of managing and processing it. Data managing systems are only efficient when they can handle this complexity without sacrificing performance.
The higher the granularity, the higher the risk of you having issues with data quality. Noise and errors, for example. These can skew analysis and model outcomes. This is why you need to implement strict data quality controls and continuous monitoring is essential.
Practical Application of Data Granularity for Product Managers
Think of a SaaS workspace tool that organizations use for project management and communication. The tool notes different data types, such as message counts, task completion rates, and user login times. By analyzing data at a granular level — for example, the exact time each message is sent and who reads it — your company can optimize features to enhance real-time collaboration. You might discover that most messages go unread when sent after 5 PM in the user's local time, leading to a feature that suggests optimal times for communication based on team activity patterns.
But if your goal is to understand broader usage trends across different regions, you will be better off reducing data granularity to daily or weekly activity logs. This level of granularity can inform decisions about resource allocation for server capacity planning during times of peak usage, ensuring a smooth user experience.
With this example, it becomes obvious that the choice of data granularity directly impacts the operational effectiveness and strategic direction of the product. The ability to toggle between different levels of data detail will allow your product team to address specific issues with precision and to plan at a higher level with much more confidence. At the same time, conscientious data management — understanding what you need and what you don't — directly influences your infrastructure and development costs, as well as the time needed for analysis and clarity for decision-making.
Here are a few examples of data with high and low granularity levels and their use cases for Product Managers:
|
Granularity Level |
Type of Data |
Example of Data |
Use Case for Product Managers |
|---|---|---|---|
|
High |
Individual user actions |
Exact times and details of user logins |
Analyzing user behavior to optimize login flows and reduce friction |
|
High |
Detailed transaction records |
Every transaction made, including time and item |
Identifying purchasing trends and optimizing inventory management |
|
High |
Real-time performance data |
CPU usage per second on a SaaS platform |
Monitoring system performance for real-time troubleshooting |
|
Low |
Aggregated user statistics |
Monthly active users |
Strategic planning and broad usage trend analysis |
|
Low |
Summarized financial data |
Quarterly revenue summaries |
High-level financial reporting and investor communications |
|
Low |
General market trends |
Annual market growth rates |
Long-term strategy development and market positioning |
Data Distribution
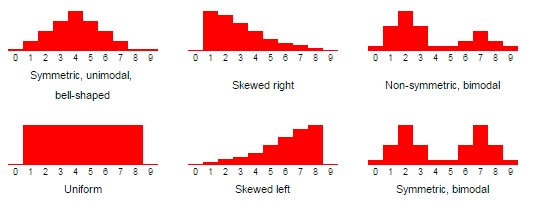
This refers to the way data points are spread across various dimensions such as values, categories, or intervals. It is a foundational concept in statistics that helps analysts understand the characteristics of the data, including its central tendencies, variabilities, and the shape of its distribution, such as normal, skewed, or uniform.
As a product manager, it’s important to know where you should look in your data and what those findings might suggest. Here’s how different types of distributions can guide your actions:
-
Normal Distribution: When data such as user engagement or feature usage closely follows a bell curve, it means that most users behave or interact with your product similarly. This uniformity can prove the effectiveness of current features or strategies, like if a user session lengths are normally distributed around a healthy average time, it suggests your app maintains user interest well.
-
Skewed Distribution: If the data is skewed (meaning most data points cluster at one end of the scale with a long tail extending to the other end) it points to outliers or unusual behaviors. So if feature usage data is heavily right-skewed (most users rarely use a feature, but a few use it extensively), it suggests that the feature is highly valuable to a niche group but perhaps not visible enough for the more broader user base. Afterward, you can conduct user research to understand why this skew exists and how to make the feature more relevant to more users.
-
Uniform Distribution:If usage across different features or times is uniform then you will see an even spread without any peaks in activity. Maybe, no single feature stands out by engagement, which might be a call to improve feature differentiation.
Once you understand these patterns, choosing the area where to pinpoint your efforts will be much easier. This way you can make better decisions in development, optimization, and even marketing strategies. Moreover, you will have data that you can base your future predictions on and prepare for them as you need.
Example: Let’s take a SaaS company that uses a workspace tool to monitor user engagement across different features like chat, file sharing, and task management. By examining the distribution of user activity across those features, the company can find out which features are most and least popular. So if the data shows a skewed distribution, with a large number of users frequently using chat but only a few using file sharing extensively, it could mean that while chat functionality meets user needs effectively, the file-sharing feature will probably need improvement or better integration into those daily workflows.
The company might also find that the distribution of login times is not really uniform throughout the day but has peaks during morning hours and just after lunch. Based on this, the company can make strategic decisions about when to schedule system maintenance to minimize disruption or when to push notifications for maximum impact.
Also, location matters. If you analyze data from various regions you will see that feature usage also varies by location, pushing you to explore localization strategies or creating region-specific features that cater to those particular needs.
Here, it becomes clear how based on recognizing and analyzing the distribution of data across different variables enables you to make informed decisions that will enhance your user satisfaction and product functionality.
Data Modeling: Simplifying Complex Data for Strategic Decision-Making
What is Data Modeling?
Data modeling is a technique that you can use to convert complex data into a format that is easier to understand and analyze. This process involves building models that predict outcomes, simulate possible future scenarios, and provide insights that aid in strategic decision-making. For product managers, this means being able to anticipate how users will behave, identify trends, and spot potential issues before they become problems. This strategic tool is key for ensuring that decisions are guided by data, rather than just intuition.
This can be used for:
-
User Segmentation: Data models analyze user behavior, preferences, and activity patterns, allowing product managers to segment users into groups. This segmentation aids in customizing the product experience to better fit different user needs, thus enhancing engagement and satisfaction.
-
Demand Forecasting: By examining historical data, product managers can use data models to forecast future demand for certain features or products. This predictive capability is crucial for managing inventory, planning marketing efforts, and aligning resources with user demands.
-
Optimizing Resources: Data modeling also predicts when user activity will peak, which helps in planning adequate server capacity to handle high traffic. This ensures a smooth, uninterrupted user experience, which is vital for user retention.
Example
One more exercise for your imagination. The situation is as follows: there is a SaaS tool that facilitates project management and collaboration among teams. This tool gathers a lot of data on how users interact with different features, communicate, and manage projects. Through data modeling, the tool’s product managers can extract highly valuable insights and predict future trends in user behavior. A model, for example, might reveal that user engagement typically peaks mid-week, and managers can then strategically allocate resources — like server capacity and support staff — much more effectively during these peak times. Also, knowing that Fridays usually see lower engagement can be the optimal time for scheduling maintenance updates that won’t annoy users.
By formulating what normal usage looks like, the model can instantly detect unusual spikes or drops in activity, anomalies that could indicate a potential system issue or even a security threat. Quick detection enables the company to address these issues quickly, minimizing any negative impact on the user experience.
Conclusion
To sum up:
-
Granularity determines the level of detail available in the data, which directly impacts what you can observe and analyze. For instance, finer granularity provides more detailed insights but may require more sophisticated handling and processing techniques.
-
Distribution helps identify the patterns and spread of data, which is critical for selecting the appropriate analysis techniques and ensuring the accuracy of predictive models.
-
Data Modeling uses the insights gained from understanding granularity and distribution to build predictive or descriptive models that inform decision-making and strategy.
Understanding and integrating the concepts of granularity, distribution, and data modeling provides a comprehensive approach to product management, especially in companies with a large user base, transaction amount or data sets.
[story continues]
tags