Table Of Links
RESULTS
This section of the study provides an overview of the results of the EDA, the correlation between the deal amount and the other features, and the model results based on different grouping of features.
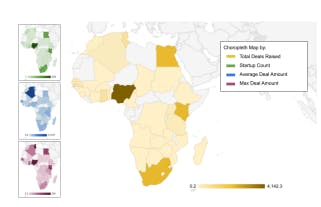
Deals vs Countries:
The chorpleth maps highlight the varying levels of fundraising success and the concentration of startups in specific countries and illustrate the relationship between the total amount raised (yellow), the number of startups(green), average deal amount (blue), and the maximum deal amount (purple) for each of the analyzed countries. The graph provides a clear visual representation of the disparities in fundraising across different African countries.
Nigeria, Kenya, South Africa, and Egypt emerge as the top technology hubs, with the highest total amount raised and a significant number of startups. However, it is also noteworthy that countries such as Algeria and Tunisia and Algeria have higher average and maximum deal amounts respectively, which may indicate a different investment landscape in these countries.
Deals and gender:
The bar plot, presents a comparison of the number of startups, total deals, and average deal amounts across three categories: startups with no women co-founders, startups with a woman CEO, and startups with women co-founders but not a woman CEO. The plot vividly illustrates the substantial gender imbalance in the African startup ecosystem. The startups with no women co-founders constitute the majority, accounting for 1,855 startups, and raising a total of M$11,891.10 with an average deal amount of M$6.41.
In contrast, startups with a woman CEO represent a relatively smaller segment, comprising 350 startups, raising M$678.70, and having an average deal amount of M$1.94. Startups with women co-founders but not a woman CEO encompass 294 startups, raising M$1,855.60, and achieving an average deal amount of M$6.31.
Deals and type of investment:
The box plot (figure 3) offers a comprehensive visualization of the distribution of deal amounts across various investment types in the African startup ecosystem, revealing considerable variation among them. For instance, Pre-Seed investments exhibit a narrow range, with a minimum of M$0.1, Q1 at M$0.2, Q3 at M$1.0, and a maximum of M$12.6. Conversely, Series C investments display a broader range, with a minimum of M$8.2, Q1 at M$24.0, Q3 at M$100.0, and a maximum of M$400.0.
The increasing deal amounts across investment rounds signify the escalating capital requirements of startups at more advanced stages. The box plot also underscores the inconsistency in amounts per investment type, particularly for the primary investment rounds (Pre-Seed, Seed, Series A, Series B, Series C, and Series E), suggesting a lack of clear term definitions within the ecosystem. This implies that the investment landscape may be influenced by various factors beyond the investment stage.
In contrast, the bar plot (figure 4) depicts the frequency distribution of investment types, demonstrating a general decline in investment frequency as rounds progress, with fewer instances in later stages such as Series D (6), Series E (2), and IPO (1). However, Venture Round investments exhibit a significantly higher frequency (814), likely because both startups and investors regard this step as a precursor to the main fundraising rounds.
Moreover, other funding sources such as Grants (299) and Debt (130) display notable occurrences. The relatively low frequency of M&A deals (18), IPOs (1), and PIPE (2) indicates a lack of development in Africa's entrepreneurial ecosystem. This observation, combined with the findings from the box plot, highlights the need for further research and policy interventions to support the growth and sustainability of the African startup ecosystem, as well as to address inconsistencies and gaps in the current investment landscape.
Deals and sector implications:
The graph presents a combined visualization of the deal sum and average deal amount by sector within the African startup ecosystem, using a bar plot and line plot, respectively. The bar plot illustrates the total deal sum for each sector, with Fintech emerging as the dominant sector with a total of M$6,947.90 in investments. Energy & Water (M$1,808.70) and Logistics & Transport (M$1,381.90) follow as the second and third highest sectors in terms of the deal sum.
In contrast, the Housing (M$77.30) and Waste Management (M$99.80) sectors exhibit the lowest total investments, indicating that these sectors may be less attractive to investors or may lack the necessary infrastructure and support for growth. Whereas, the line plot represents the average deal amount per sector, with Deeptech (M$10.52) and Fintech (M$10.39) sectors showing the highest average deal sizes.
This suggests that these sectors typically attract larger investments, possibly due to their potential for disruptive innovation and scalability. On the other hand, the Services (M$1.52) and Waste Management (M$1.72) sectors display the lowest average deal amounts, indicating that investments in these areas may be relatively modest or focused on smaller-scale projects.
Deals and Y combinator implications:
The graph provides a visual comparison of the total deals, average deal amount, and count of startups for two distinct categories within the African startup ecosystem: Y Combinator-backed startups (224 startups) and non-Y Combinator-backed startups (2,085 startups). This comparison allows for an assessment of the potential impact of Y Combinator affiliation on startup investments.
The graph illustrates that Y Combinator-backed startups have raised a total of M$1,992.00 in deals, while non-Y Combinator-backed startups have raised a considerably higher sum of M$12,433.40. However, it is essential to consider the difference in the number of startups in each category. There are 224 startups in the Y Combinator category, while the non-Y Combinator category comprises 2,085 startups.
The average deal amount, which accounts for the varying number of startups in each category, reveals a different pattern. Y Combinator-backed startups exhibit a higher average deal amount (M$8.89) compared to their non-Y Combinator counterparts (M$5.96). This suggests that startups affiliated with Y Combinator tend to attract larger investments, possibly due to the accelerator's reputation, resources, and mentorship.
Correlation Matrices:
This sub sub-section presents the results of correlation matrices to explore the relationships between various features and their impact on deal amounts in the African startup ecosystem. The analysis is conducted by examining different groupings of features and identifying those that exhibit high positive or high negative correlations with deal amounts. Table 1 shows the top two features with high positive correlations while Table 2, shows the top two features with high negative correlations for each group.
These correlations provide insights into the factors that may influence deal amounts and inform potential strategies for entrepreneurs, investors, and policymakers to foster growth in the African startup ecosystem. For instance, the analysis reveals that the number of employees and the exit type have high positive correlations with deal amounts, while the CEO's graduation year and the presence of a woman CEO show high negative correlations.
This information can guide stakeholders in understanding the dynamics of the startup ecosystem and tailoring their strategies accordingly. By examining the correlation matrices, we aim to deepen our understanding of the African startup landscape and identify trends that may influence investment decisions, startup growth, and overall ecosystem development.
Model Performance:
The table above rigorously assessed the efficacy of various machine learning algorithms used in predicting deal amounts in African startup investments, contingent upon specific groups of features. The analysis unveiled disparate model performance contingent on the features under consideration, underscoring the necessity of tailoring model selection to the pertinent features.
Linear Regression, adept at estimating coefficients of predictor variables to fit a linear equation to the data, exhibited superior performance for features F, C, and F+C, as evidenced by MSE values ranging from 19.524 to 24.272. Conversely, the Random Forest and Gradient Boosting models demonstrated commendable performance across all features, particularly for F+C+I, suggesting their proficiency in capturing intricate relationships and interactions among features.
In comparison, Support Vector Regression (SVR) displayed elevated MSE values for all features, indicative of suboptimal performance relative to the other models. The Random Forest model displayed optimal performance for the I and F+C+I features, implying its suitability as the most appropriate model for predicting deal amounts in African startup investments. T
he confluence of founder features (F), company-related features (C), and investment/investor-related features (I) emerged as critical predictor of deal amounts, as evidenced by the lowest MSE values across all models. The consistent performance of the combination of F, C, and I (F+C+I) accentuates its significant impact on the prediction of deal amounts in African startup investments.
The consistent performance of the F+C+I feature group with the 4 algorithm used, highlight the substantial influence of this group on predicting deal amounts in African startup investments. Thus, it is imperative to investigate the correlation coefficients between the deal amount and other features within the F+C+I group.
A deeper understanding of these correlations will offer valuable insights into the relative importance of each feature, enabling us to make informed decisions and adopt targeted strategies to foster the growth in the discussion section.
Author:
This paper is