
Previously we found some of the major concentration of open source coders around pretty cold places (Iceland, Sweden, Norway…). The question we want to solve today: Do programmers really prefer colder countries?
Open source coders per capita. Source: https://medium.com/@hoffa/github-top-countries-201608-13f642493773
First question to solve before we can correlate coders per capita to a country’s weather — is it possible to get an “average temperature point” to define each country? First, let’s write the query, and then we’ll discuss if it makes sense:
#standardSQL
SELECT *, ROUND((fahr_avg-32)*5/9, 2) celsius_avg
FROM (
  SELECT country, COUNT(DISTINCT stn) stations, ROUND(AVG(temp), 2) fahr_avg
  FROM `bigquery-public-data.noaa_gsod.gsod2016` a
  JOIN `bigquery-public-data.noaa_gsod.stations` b
  ON a.stn=b.usaf AND a.wban=b.wban
  GROUP BY country
)
ORDER BY stations DESC
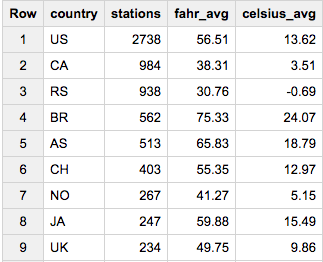
Quick things we can see here:
- The US had 2,738 weather stations reporting data on the NOAA GSOD tables in 2016.
- Canada, Russia, Brazil, and Australia follow the US in number of stations, with 984, 938, 562, and 513.
- Russia is crazy cold, with an average yearly temperature overall below freezing. Meanwhile Brazil is the warmest in this sample, followed by Australia.
- Does it make sense to average all of these points and call it a country’s temperature? One of the supporting arguments is that weather stations are not evenly distributed across a country, but instead weather stations concentrate around the biggest population centers — this will weight our averages appropriately.
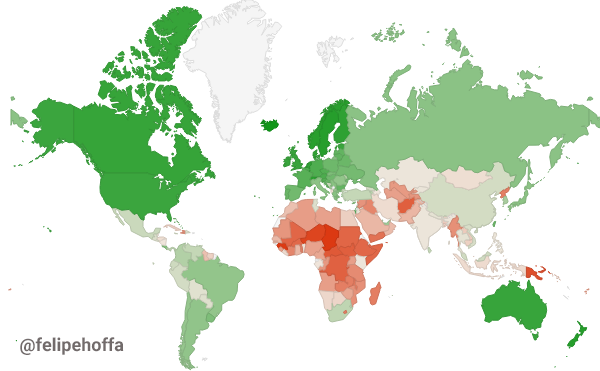
A chart summarizing the average temperature for all the NOAA GSOD weather stations in each country:
<a href="https://medium.com/media/5dab4a4672113419e8223500a869ac8c/href">https://medium.com/media/5dab4a4672113419e8223500a869ac8c/href</a>
The chart makes sense — we see some countries with way larger dispersion than others, but their relative average position within each other matches our expectations (and yeah… Chad’s the hottest one). Now we can match this set with the GitHub’s “programmers per capita” metric:
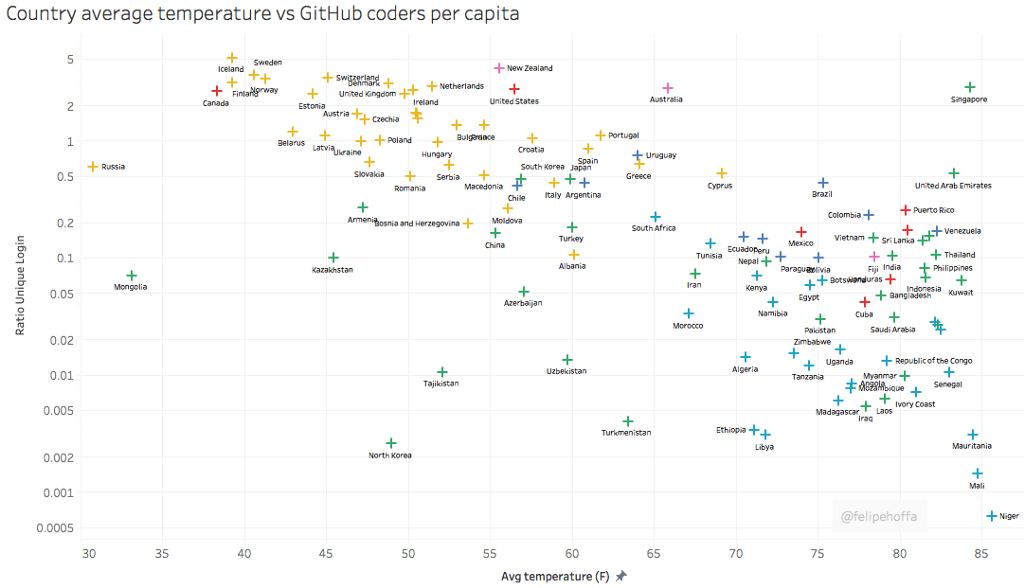
Yes — we can find an exponential trend line which matches our expectations:
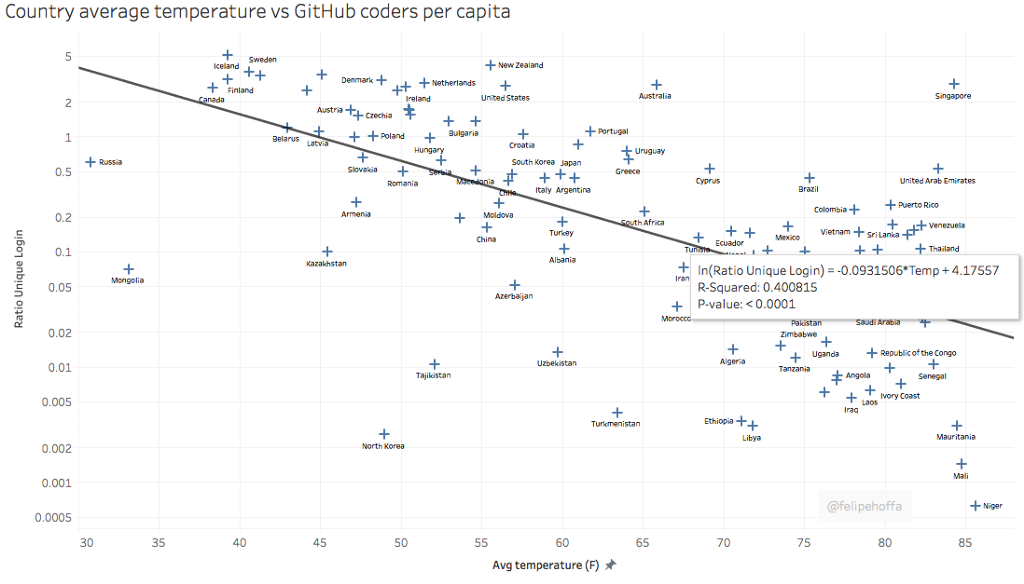
Some interesting observations:
- There’s a larger concentration of open source programmers around colder countries.
- Within the colder countries, some underperform the expected concentration of coders: Russia, Mongolia, Kazakhstan, Tajikistan, and North Korea.
- For warm weather and programmers, go to the countries that exceed our expectations: Australia, Brazil, United Arab Emirates, and Singapore.
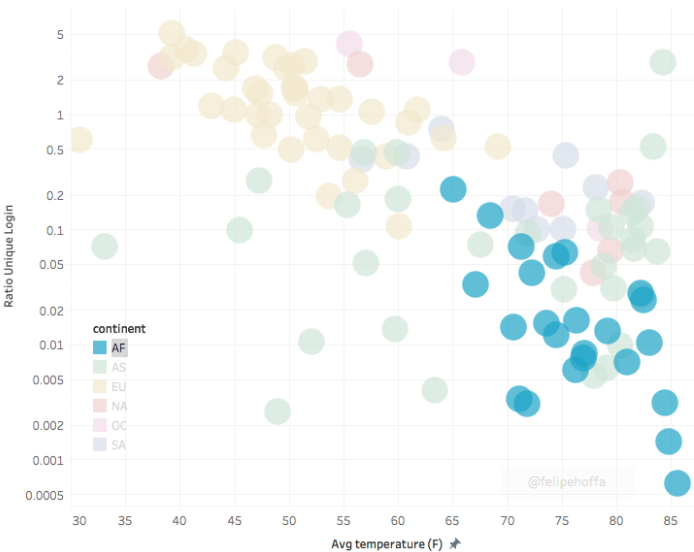
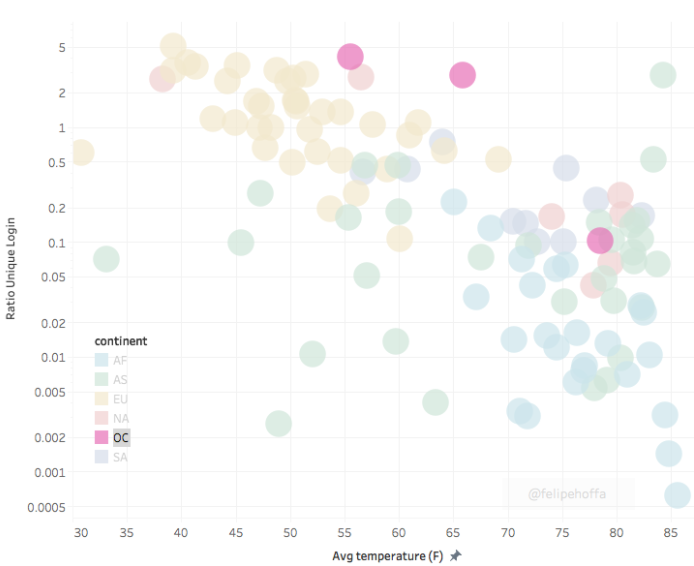
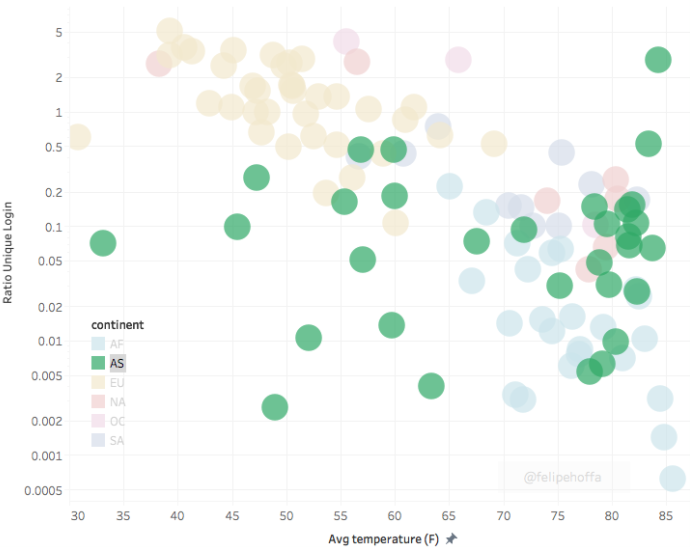
There are also some interesting findings if we group this data by continent:
- African countries have the warmest weather and lowest concentration of coders. For more on this, see my report on Africa.
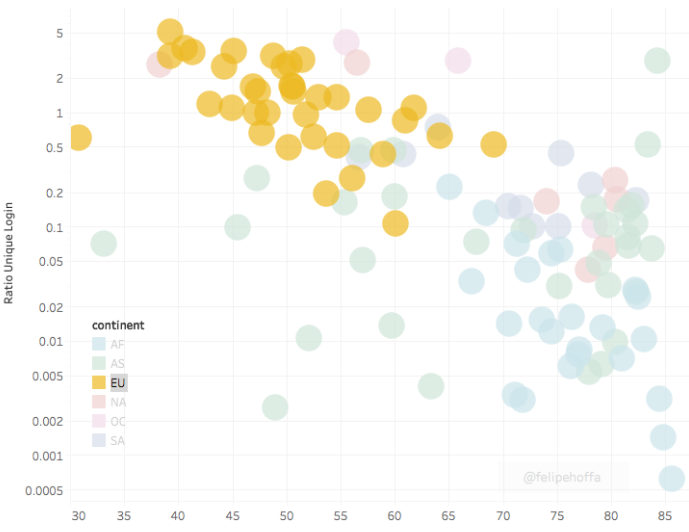
- European countries have the largest concentration of coders, and moderate weather:
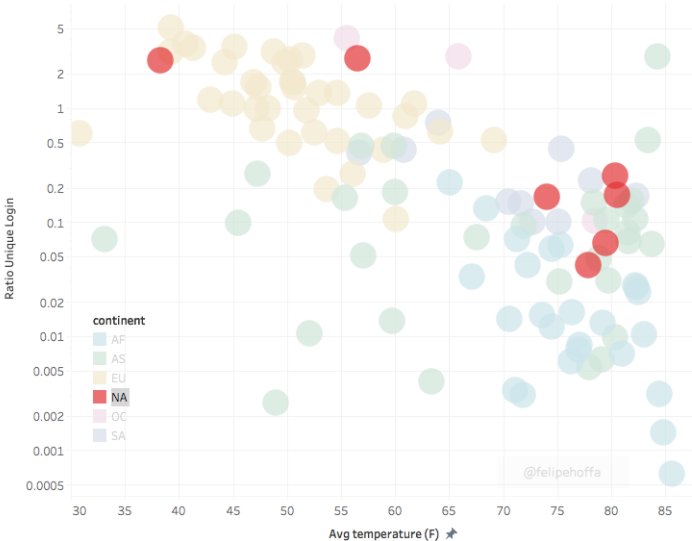
- In North America there’s a huge gap between the US, Canada, and the rest of the countries:
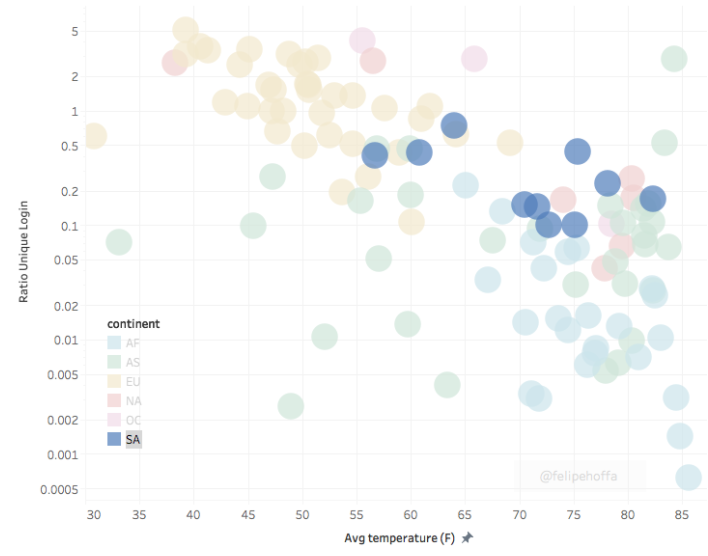
- South America - Warmer than Europe, but with lower concentrations of programmers:
- Oceania — above average temperature and number of coders, matching our expected curve:
- Asia breaks our trends: It has some of the coldest and warmest countries. According to this chart the coldest Asian countries have the lowest concentrations of coders, while the hottest one (Singapore) has an outstanding number of them:
Data and queries:
Data: GitHub Archive (Ilya Grigorik), GHTorrent (Georgios Gousios), NOAA GSOD — all on BigQuery.
Tools: BigQuery, Google Sheets, Exploratory (Kan Nishida), Tableau, re:dash (Arik Fraimovich).
#standardSQL
SELECT a.country, temp, ratio_unique_login, continent
FROM (
  SELECT c.country, ROUND(AVG(temp),2) temp, COUNT(DISTINCT stn) stations, ANY_VALUE(continent) continent
  FROM `bigquery-public-data.noaa_gsod.gsod2016` a
  JOIN `bigquery-public-data.noaa_gsod.stations` b
  ON a.stn=b.usaf AND a.wban=b.wban
  JOIN `gdelt-bq.extra.countryinfo2` c
  ON b.country=c.fips
  GROUP BY 1
  HAVING stations > 10 OR c.country='Singapore'
) a JOIN (
  SELECT c.country, ANY_VALUE(c.population) population
    , 10000*COUNT(DISTINCT login)/ANY_VALUE(c.population) ratio_unique_login
  FROM `githubarchive.month.201608` a
  JOIN `ghtorrent-bq.ght_2017_04_01.users` b
  ON a.actor.login=b.login
  JOIN `gdelt-bq.extra.countryinfo2` c
  # http://download.geonames.org/export/dump/readme.txt
  ON LOWER(c.iso)=b.country_code
  WHERE country_code != '\\N'
  AND population > 300000
  AND a.type='PushEvent'
  GROUP BY 1
) b
ON a.country=b.country
ORDER BY 3 DESC
Next steps
See other interesting weather posts: Lakshmanan V’s How to forecast demand with Google BigQuery, public datasets and TensorFlow, Reto Meier’s Investigating Global Temperature Trends with BigQuery and Tableau.
Want more stories? Check my Medium, follow me on twitter, and subscribe to reddit.com/r/bigquery. And try BigQuery — every month you get a full terabyte of analysis for free.
[story continues]
tags