
Table of Links
6. Conclusion, References, and Appendix
4 RESULTS
In the following section, we characterise how posting and commenting activity changed during the period of increased media coverage (RQ1), then we investigate trends in the behaviour of heavy and light users (RQ2), and, lastly, we see how the distribution of topics changed between the three time periods (RQ3). Unless stated otherwise, all analyses refer to the time period between January 1 2019-July 31 2022. Figures are limited to the period between May 1 2021-July 31 2022 for the sake of clarity.
4.1 RQ1: Subreddit Activity
The mainstream media usually points to the number of r/antiwork subscribers to illustrate its growth and popularity (see Figure 1). However, in addition to subscribing, users can interact with a subreddit by posting, commenting and voting. As Reddit no longer provides the number of up- and down-votes to third parties, we focused on users’ posting and commenting behaviour.
Figure 2 shows the daily number of posts submitted to r/antiwork that received at least one comment. Up until mid-2021, the average number of posts per day grew steadily, for example, increasing
from 46.4 in January 2020, just prior to the start of the Coronavirus pandemic, to 76.8 in April 2021. From May 2021, the rate of posting started to accelerate, consistently breaching 200 posts per day by September, before growing exponentially from October 9 to the weekend of October 23-24. From late October 2021, posting behaviour settled into a pattern of heightened activity during weekdays that dips during the weekends. At its peak, 2,658 posts were made on January 26, the day after Doreen Ford’s Fox News interview, before collapsing to less than half the posting volume of the preceding month. On January 27 2022, r/antiwork lost 38,228 subscribers (2.2%) (see the right hand edge of the grey region in Figure 1). For comparison, the second biggest dip in subscribers was on February 24 2019 when the number of subscribers decreased by 7.
Figure 3 shows similar trends in commenting behaviour: an exponential increase in mid-October 2021 followed by a sudden collapse in late January 2022. Unlike posting, however, there is no obvious differences between commenting volume on weekdays versus weekends. As with the posts to r/antiwork, the number of comments peaked during January 26-28, before falling 46.2% on January 29 2022.
The dashed lines on Figures 2 and 3 show the results from change point detection. In Figure 3, the first change on October 14 follows a viral post by u/hestolemysmile (the single most commented on post on r/antiwork[12]). In Figure 2, the first two changes on October 15 and 22 coincide with the publication of widely-circulated articles by Newsweek and the New York Times, respectively. In both Figures 2 and 3, January 29 was identified as the number of posts and comments fell after the Fox News interview. The remaining events appear to be around seasonal holidays: posts appear to increase following Thanksgiving (November 30), while comments increase on the first working day after Christmas (December 27). The last events related to posting (May 13 2022) and commenting (February 11 and May 14 2022) do not appear to be related to specific events, but is the model acknowledging more gradual downward shifts in activity.
4.2 RQ2: Behaviour of Heavy and Light Users
The results from RQ1 showed that consistently growing subscriber counts do not necessarily lead to ever-increasing numbers of posts and comments, but are contingent on external events. Here, we investigate the behaviour of heavy and light users (defined in Section 3.2.1) to understand who is driving the changes in the volume of posts and comments. We also look at when users made their last comment to the subreddit to assess whether users stopped engaging with r/antiwork or simply comment less frequently after the interview on Fox News.
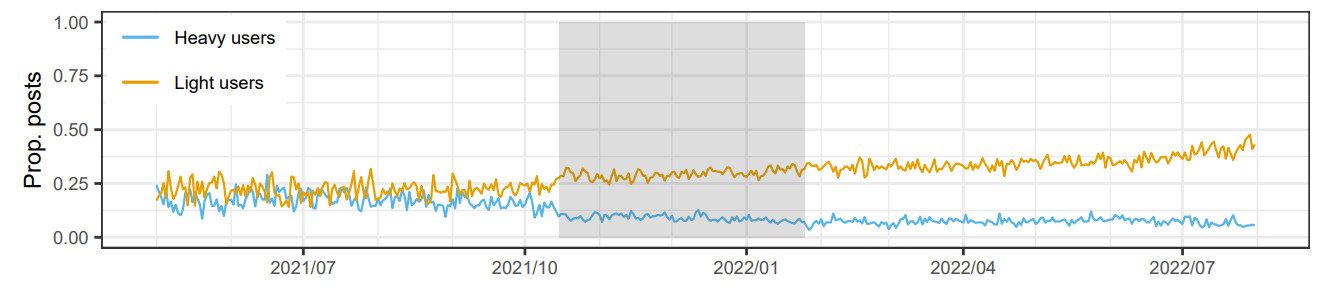
Figure 2 shows that posting behaviour is mostly driven by light posters, who were responsible for 29.6% of posts, compared to 10.1% for heavy posters. Figure 4 shows that the proportion of posts made by light and heavy posters were approximately equal prior to October 2021, but then start to diverge with almost half of posts coming from light posters by the end of July 2022. Conversely, Figure 3
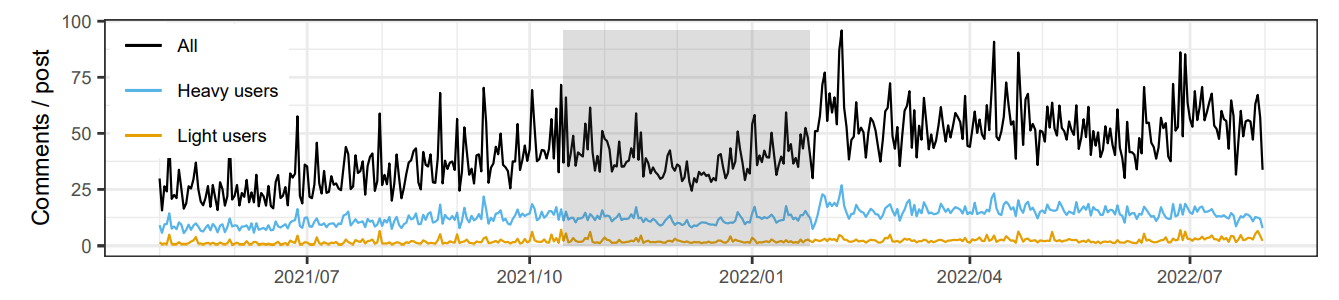
shows that heavy commenters make more comments in aggregate than light commenters (29.8% vs. 4.7%). Unlike users’ posting behaviour, however, the average number of comments per post remained relatively constant over time for both types of commenters, a trend that appears to be unaffected by the surge in subscribers (see Figure 5).
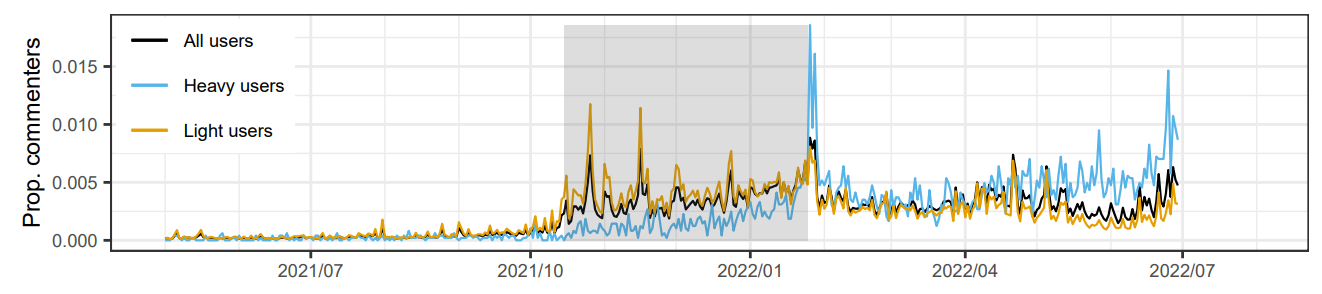
Lastly, in Figure 6 we investigated when users made their last comment to r/antiwork (we omitted the last month’s data for clarity as many of these users will continue commenting in the future). Between October 2021 and January 2022, a majority of users commenting for the last time were light commenters, i.e. their last comment is their first and only comment. The proportion of heavy commenters making their last comment remained low until January 26-28 2022 when 4.4% of heavy commenters made their final comment. After January 2022, it was equally likely that heavy and light commenters stopped commenting until May 2022 when it became more likely for heavy commenters to stop commenting than light commenters of r/antiwork.
4.3 RQ3: Content Analysis
In RQ1, we showed that the volume of posts and comments increased dramatically in October 2021 before collapsing in January 2022. In RQ2, however, we saw that an increasing proportion of posts came from light users, i.e. users who only post once. We want to understand how these two phenomena affected what was discussed on r/antiwork using topic modelling. We investigate the optimal number of topics and contrast the topic distributions for the three time periods defined in Section 3.2.2.
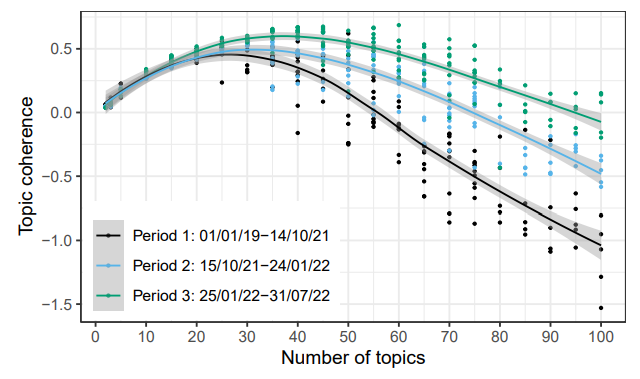
We used topic coherence to identify the optimal number of topics. Figure 7 shows the coherence scores for topic models with 5-100 topics in increments of 5. We performed either 5 or 10 replicates for each number of topics for each time period (more replicates were run for 15-75 topics where the coherence score was maximised). The optimal number of topics was 25, 30 and 40 for periods 1, 2 and 3, respectively. The different number of topics in each time period appears to confirm our decision to split the data set for topic modelling and is suggestive that the topics discussed broadened over time. We note, however, that while periods 2 and 3 have a similar number of documents (comments aggregated by parent post), period 1 is considerably smaller (see Section 3.4).
Table A1 shows which topics were present, their proportion and the topic ranking for each time period. In periods 1 and 3, the topranking topic was Quitting, whereas in period 2, when r/antiwork itself was being featured in numerous news stories, the top-ranking topic was Reddit. The top-3 topics for all time periods were the same: Quitting, Reddit and Mental Health and accounted for 22.5-27.5% of the content on r/antiwork. In total, 17 topics appeared in all three time periods, accounting for 60.6-74.1% of content. Each time period had unique topics, many of which were based on seasonal events and major stories in the news media. Period 1 included Leisure (i.e. hobbies and free time) and Social Security (disability, welfare). Period 2 included Holidays (period 2 covered both Thanksgiving and Christmas), Corporations (related to, for example, Kellogg’s union busting activities) and Pandemic (in particular, stories of working during the pandemic). Lastly, period 3 included topics for the Fox News Interview, Working from Home (in opposition to companies’ post-pandemic return to office policies) and Reproductive Rights (related to the leaked U.S. Supreme Court draft decision to overturn Roe v. Wade). Topics confined to a single time period, however, tended to be relatively minor and were generally present in the long-tail of the topic distribution.
Authors:
(1) Alan Medlar, University of Helsinki, Finland (alan.j.medlar@helsinki.fi);
(2) Yang Liu, University of Helsinki, Finland (yang.liu@helsinki.fi);
(3) Dorota Głowacka, University of Helsinki, Finland (dorota.glowacka@helsinki.fi).
This paper is available on arxiv under CC BY 4.0 DEED license.
[12] https://www.reddit.com/r/antiwork/comments/q82vqk/
[story continues]
tags