Table Of Links
- DEFINITIONS
- DESIGN GOALS
- FRAMEWORK
- EXTENSIONS
- CLASSIFIERS
- FEATURES
- VULNERABILITY FIXING LATENCY
- ANALYSIS OF VULNERABILITY FIXING CHANGES
- ANALYSIS OF VULNERABILITY-INDUCING CHANGES
- N-FOLD VALIDATION
- EVALUATION USING ONLINE DEPLOYMENT MODE
- IMPLICATIONS ON MULTI-PROJECTS
- IMPLICATIONS ON ANDROID SECURITY WORKS
- THREATS TO VALIDITY
- ALTERNATIVE APPROACHES
VI. CHARACTERIZATION
This section characterizes the collected vulnerability data. We note that Subsection VI.A utilizes all CVEs published in the Android Security Bulletins (ASB) from August 2015 to December 2023; Subsection VI.B utilizes CVEs published on ASB in the first year (from August 2015 to July 2016), and Subsection VI.C focuses on the CVEs found in the framework/av project of AOSP.
A. VULNERABILITY FIXING LATENCY
Let us first analyze the time taken to detect and fix vulnerabilities in AOSP. Specifically, the number of days between each vulnerability-inducing release and its corresponding vulnerability-fixing release is measured. Figure 3 shows the results for each AOSP version (shown in the legend).
For a majority of the AOSP versions, the measured vulnerability fixing latency peaks between 1,000 and 1,300 days (i.e., 3–4 years). The exception is seen in the recent releases (e.g., Android 13 and 14 released in <2 years) where the latency is also less than 2 years12 . The tail is also long. For example, some vulnerabilities introduced in the two AOSP releases (e.g., v8.1) take over 4 years (>1,450 days) to be fixed.
While Figure 3 captures the time between vulnerabilityinducing and fixing releases, it presents a conservative view. It excludes the time from the submission of a ViC to its corresponding AOSP release which is about a half year on average. Similarly, it does not include the time from a fixed AOSP release to OEM device updates [41][42]. Consequently, the true latency from ViC submissions to VfC rollouts to the user devices is longer (e.g., ~5 years instead of 4 years in Figure 3). Additionally, since the security update support window of the Pixel devices by an Android OEM is recently extended to 7 years in 2023 from the previous 5 years, the true latency for the older releases with the shorter support window could be longer than the data shown in Figure 3.
We note that the vulnerability fixing latency distribution is accurate for each AOSP dessert release version. However, it does not directly show the vulnerability fixing latency distribution of Android OEM devices in the field. It is because Android OEM devices are usually upgraded to newer Android dessert releases thanks to the fast software update efforts (e.g., TREBLE [37]) since Android 8.1. To show how to estimate the vulnerability fixing latency for OEM devices, let us consider an OEM device launched with Android 9.0, upgraded to Android 10 after one year, and upgraded to Android 11 after another year before reaching its End of Life (EoL). The vulnerability fixing latency for that OEM device can be calculated by concatenating: (1) the first year of vulnerability fixing latency data for Android 9.0;
(2) the first year of data for Android 10; and (3) the entire vulnerability fixing latency distribution for Android 11.
B. ANALYSIS OF VULNERABILITY FIXING CHANGES
Given the observation that AOSP vulnerabilities can take over 4 years to fix, this analysis uses vulnerabilities fixed and published in the AOSP security bulletins during the first year (from August 2015 to July 2016). Those vulnerabilities are mostly found in the Android 4.1–6.0 releases, namely, Jelly Bean, KitKat, Lollipop, and Marshmallow.
Vulnerability Fix Rate. Over the analyzed one year, 356 CVEs are fixed, averaging approximately 0.975 (≈ 1) CVE fixes per day. However, relatively large variations are seen in this rate across the 12 months as shown in Figure 4. It shows how the vulnerabilities fix pattern changed over the one year period. The CVE fix pattern shifts noticeably, with a sharp increase in the number of fixes during the final four months of the analyzed release period. The surge aligns with approaching yearly AOSP and Pixel device releases.
The seasonal pattern reflects the increasing focus on the security and stress testing as it gets close to the yearly release deadlines. Specifically, the emphasis during the initial months was on hardening the media and codec components of the Android native system. With the Android 7.0 (Nougat) release nearing, additional triggers were added to find the upstream Linux kernel vulnerabilities. Such shifts in testing focus are common during a software release lifecycle. Limited testing resources must be strategically allocated in accordance with development progress in order to ensure the quality, security, and other system integration requirements.
Vulnerability Severity Distribution. The severity data of the addressed CVEs reveals the importance of those fixes. About 82.9% (i.e., 32.9% critical and 50% high) of the fixed CVEs is categorized as critical or high. Here, critical or high means the fixes are promptly created and integrated into the main and all the backport branches for monthly releases, expediting the fix rollouts compared to a annual update cycle from the main branch for the moderate or low severity issues. 15.7% of the same is classified as ‘moderate’ and only 1.4% is classified as ‘low’ or ‘none’.
Code Fixes for Vulnerabilities. There is a many-to-many relationship between the CVEs and their code fixes.
1-to-1 relationship. Typically, a single CVE issue fix is done by a single code change (e.g., git commit).
1-to-M relationship. Some CVE fixes require multiple code changes. For the analysis purpose, code changes addressing the same CVE issue are grouped together if the changes are in a single git project. It reflects the observed common practice of developers splitting large fixes into smaller, more manageable code changes. Additionally, a code change related to deploying a fixed kernel image (e.g., to drop a rebuilt image to an Android repository) is considered part of the initial code change in a kernel code repository, as the change for a kernel image deployment stems from the initial source code change.
N-to-1 relationship. Conversely, a single code change can sometimes resolve multiple CVEs. This is seen in cases of redundant CVEs for the same vulnerability or when multiple CVEs share a common root cause. Another example of an N-to-1 relationship is for when related CVEs exist for each affected device type (or chipset). Similar code changes applied to different device-specific branches are grouped together, including non-trivially cherry-picked changes with minor device- or chipset-specific adjustments. These semantically similar code changes are considered a single fix.
N-to-M relationship. While it is rare, fixing CVEs with a seemingly N-to-1 relationship can sometimes involve more than one code changes. If distinct code changes remain across multiple system abstraction layers after the fore described grouping practices, the layer containing the most significant fix is prioritized for analysis.
Abstraction Layers of Code Changes. Figure 4 reveals the distribution of the first year AOSP CVE fixes across the system abstraction layers (or software subsystem-component types). Initially and consistently, many CVEs are addressed in the Android system layer13 (such as the native servers, Hardware Abstract Layer modules, and Native Development Kit libraries [37]). Notably, the final quarter saw a significant increase in CVE fixes with the kernel layer.
Among the CVE fixes, nearly half (46.7%) target the Android system. A significant portion (33.5%) addresses the Linux kernel, while firmware fixes (such as bootloader) make up 4.2%. The remaining 19.8% is distributed as follows: Android app (~3.1%), Android Java framework (9.3%), other non-native code (5.1%), and configurations such as the SELinux policy, kernel config, init run command, and Android build rule (2.3%).
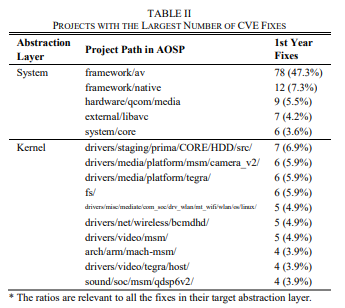
The Android native software components are about 5.8 times more likely to contain the CVEs compared to the Android Java programs and configurations. Table II shows the system and kernel projects with the most CVE fixes. The higher security of Java code stems from the two factors: the app store inspection process for Android apps and the inherent security benefits of type-safe Java and Kotlin programming languages used by Android apps and the Android framework. Here, the native software components are often developed by third-party contributors and other open source communities (e.g., GitHub and Linux kernel).
However, vulnerabilities in the native code pose a significant security threat due to the powerful system privileges their attackers can exploit. Those low-level attacks can, in theory, subvert any overlying software running on top of the target layer and often do not require any user actions (e.g., app installation) to be triggered them. For example, it is possible to remotely exploit a system-level vulnerability through an MMS (Multimedia Messaging Service) message, even if the message is never opened by device users. As a result, it is often difficult to detect such system layer attacks.
Table II details the distribution of the system and kernel CVE fixes across their projects. The top five system projects in the table account for 67.9% of the first year, system-layer fixes. Notably, the framework/av project encompasses ~46% of the system-layer fixes, demonstrating the highest sample density. Within the kernel itself, drivers lead the pack with 72.5% of the CVE fixes, followed by the architecturespecific code (arch) at 8.8%, file system (fs) at 5.9%, and sound related code at 6.9%. The top 10 kernel projects encompass 51% of the first year, kernel CVE fixes.
C. ANALYSIS OF VULNERABILITY-INDUCING CHANGES
For characterizing ViCs, let us focus on the CVEs fixed within the AOSP framework/av project, which exhibits the highest fixed vulnerability density. The project is a valuable target for in-depth ViC analysis due to the extensive testing (including fuzzing), the security hardening efforts in the Android Nougat release (e.g., vulnerabilities fixes), and its large size (e.g., 3,513 non-hidden files and directories, comprising 254,899 lines of C/C++ source code, configs, documents, and build rules).
Fixing a single CVE issue can involve several VfCs. Of the 359 fixed CVEs analyzed, 77 require multiple VfCs that are merged into the target project. In total, those 77 CVEs are associated with 354 VfCs. Further analysis, using district code change identifiers, uncovers 244 unique VfCs. Our toolset then employs those unique VfCs to identify a total of 551 ViCs, which are subsequently characterized using our classification feature data types.
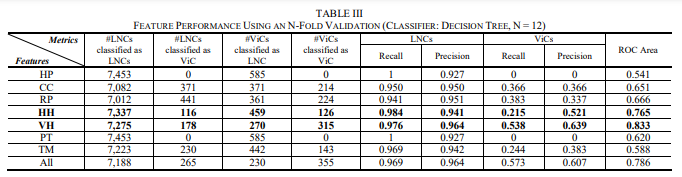
Table III summarizes the initial evaluation results for each feature set using a decision tree classifier. For example, the third column shows how many LNCs the VP framework predicts as ViCs. Notably, the HH (Human History) and VH (Vulnerability History) feature sets achieve high accuracy in ViC identification. Conversely, neither the HP (Human Profile) nor PP feature sets detect any ViCs, while the remaining feature sets exhibit varying accuracy levels.
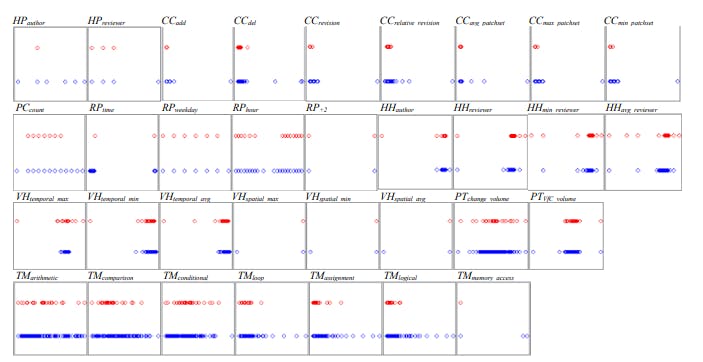
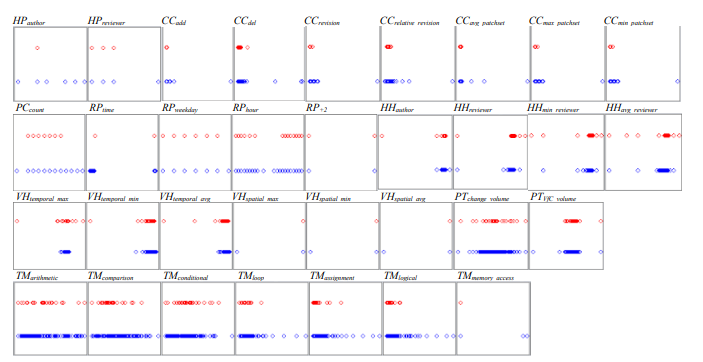
Figure 5 visually analyzes feature values to provide deeper insights into the effectiveness of different feature sets. It shows the distribution of feature values for both ViCs (red symbols, upper row) and LNCs (blue symbols, lower row). The x-axis represents the value range of each specific feature data type. The visualization reveals patterns explaining why certain feature sets perform better than others in predicting ViCs.
The HP feature set shows limited effectiveness in AOSP because it relies on two discrete features. ViCs tend to cluster within a narrower range of those feature values compared to LNCs (e.g., ViCs utilize only one value of the HPauthor feature). The limited value distribution likely stems from the target project development being primarily handled by a single organization, fostering consistent coding practices within the AOSP framework codebase. Consequently, code change author affiliation is not a strong predictor of vulnerabilities within AOSP.
The initial hypothesis that malicious external contributors were a primary source of vulnerabilities proves incorrect in Android platform developments. The data analysis reveals that most ViC authors are not malicious third-party actors. It
is likely due to the rigorous collaboration process in place for external contributions to AOSP: such contributors usually lack direct commit permissions, and their code changes can sometimes undergo extensive scrutiny by the project owners. Thus, the observation is AOSP vulnerabilities are more likely to arise when both authors and reviewers are trusted entities and consequently there is reduced inspection and testing thoroughness.
The CC (Change Complexity) feature set reveals a pattern. Most ViCs involve small- or medium-sized code changes, while LNCs exhibit a wider range of sizes, encompassing both tiny and extra-large code changes. It suggests that code modifications exceeding a certain size threshold (e.g., >250 lines) would introduce enough complexity to distract both authors and reviewers, increasing the likelihood of undetected vulnerabilities. However, some extremely large code changes often involve repetitive or mechanical edits (e.g., pattern-based refactoring or removing deprecated code) rather than modifications to intricate logic, making them less prone to oversights. Interestingly, the CCrevision feature also indicates that ViCs typically undergo fewer revisions during their code reviews compared to LNCs. The observation supports the idea that some LNCs may initially contain vulnerabilities that are addressed through the code review process, leading to more revisions.
The HH (Human History) feature set confirms a trend. In general, authors and reviewers previously involved in ViCs are more likely to be associated with the introduction of new ViCs. This pattern is evident in Figures 5 (HHauthor and HHreviewer sub-graphs), where ViCs exhibit high-density clusters slightly to the right of LNC value clusters. The sparse distribution on the left side of the upper row (representing individuals with only one ViC at the time of analysis) is likely to converge towards the right side cluster for ViCs over time. This finding highlights the importance of identifying ViCs and providing early, targeted feedback to the involved software engineers. Such feedback can improve their understanding of vulnerabilities, aiding prevention efforts in the near future.
The VH (Vulnerability History) feature set indicates ViCs and LNCs generally modify a similar set of files. However, some ViCs introduce changes to previously untouched files. Such modifications on untouched files consistently result in vulnerabilities in the analyzed dataset. It can be explained by the two scenarios: a newly created file is modified for the first time, introducing a ViC, or a file undergoes multiple local edits that are later combined (e.g., using git squash mechanism) into a commit (ViC) visible on the main repository. The practice of infrequently upstreaming large, merged changes potentially increases the risk of vulnerabilities.
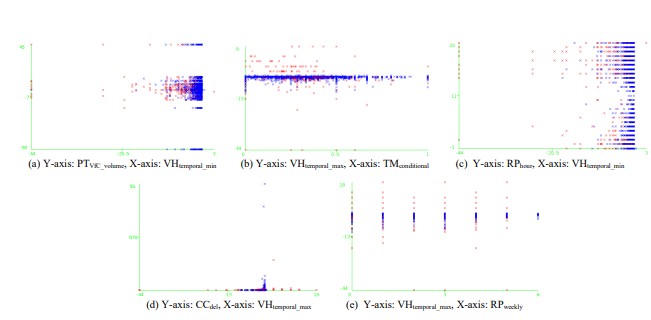
This paper prioritizes characterization of impactful feature sets. Other individual feature sets are omitted due to redundancy with the fore described characteristics or the lack of clear patterns in their visualizations in Figure 5. It, at the same time, underscores the importance of multivariate analysis, as demonstrated in Figure 6. Here, specific combinations of two features (i.e., 5 pairs in total) yield relatively effective classifiers with clear clustering patterns (or hyperplanes) in the two-dimensional space. Analyzing only single features or pairs would provide an incomplete understanding of the true potential of the entire feature sets, given the numerous informative combinations possible. Thus, a comprehensive evaluation study is crucial.
Author:
This paper is
[story continues]
tags