
This article is co-written by me and my colleague Kai Dai. We are both data platform engineers at Tencent Music (NYSE: TME), a music streaming service provider with a whopping 800 million monthly active users. To drop the number here is not to brag but to give a hint of the sea of data that my poor coworkers and I have to deal with everyday.
What We Use ClickHouse For
The music library of Tencent Music contains data of all forms and types: recorded music, live music, audios, videos, etc. As data platform engineers, our job is to distill information from the data, based on which our teammates can make better decisions to support our users and musical partners.
Specifically, we do all-round analysis of the songs, lyrics, melodies, albums, and artists, turn all this information into data assets, and pass them to our internal data users for inventory counting, user profiling, metrics analysis, and group targeting.
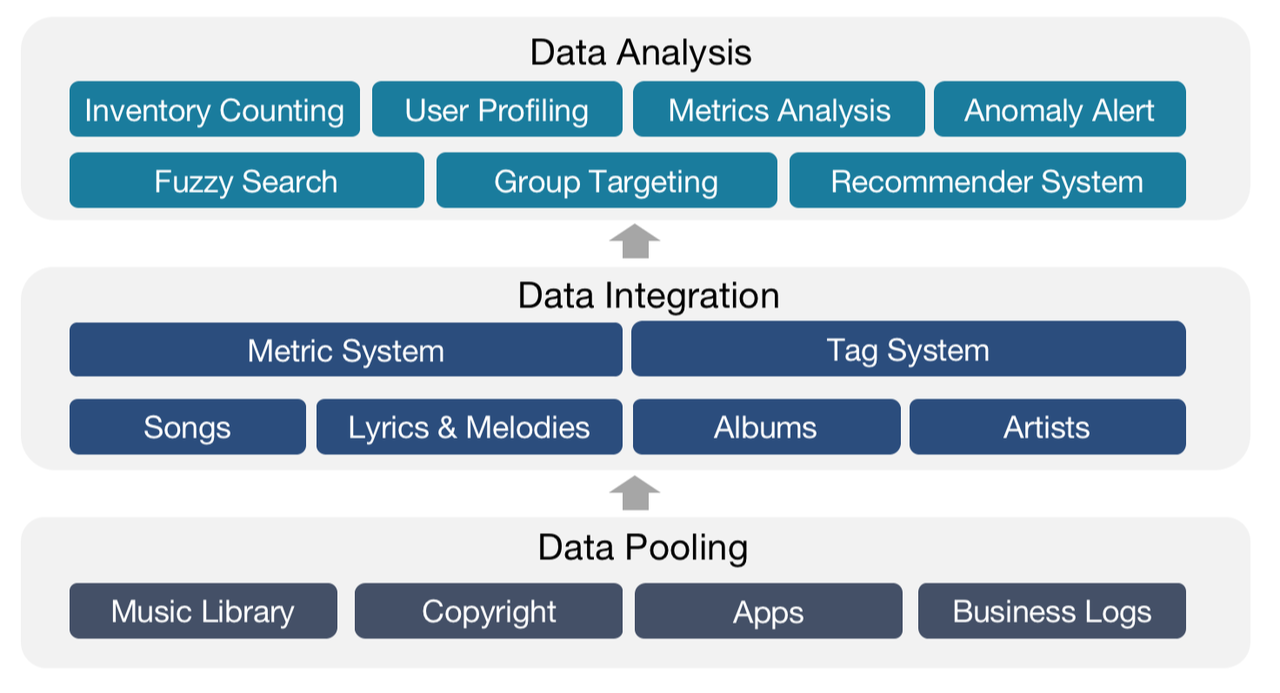
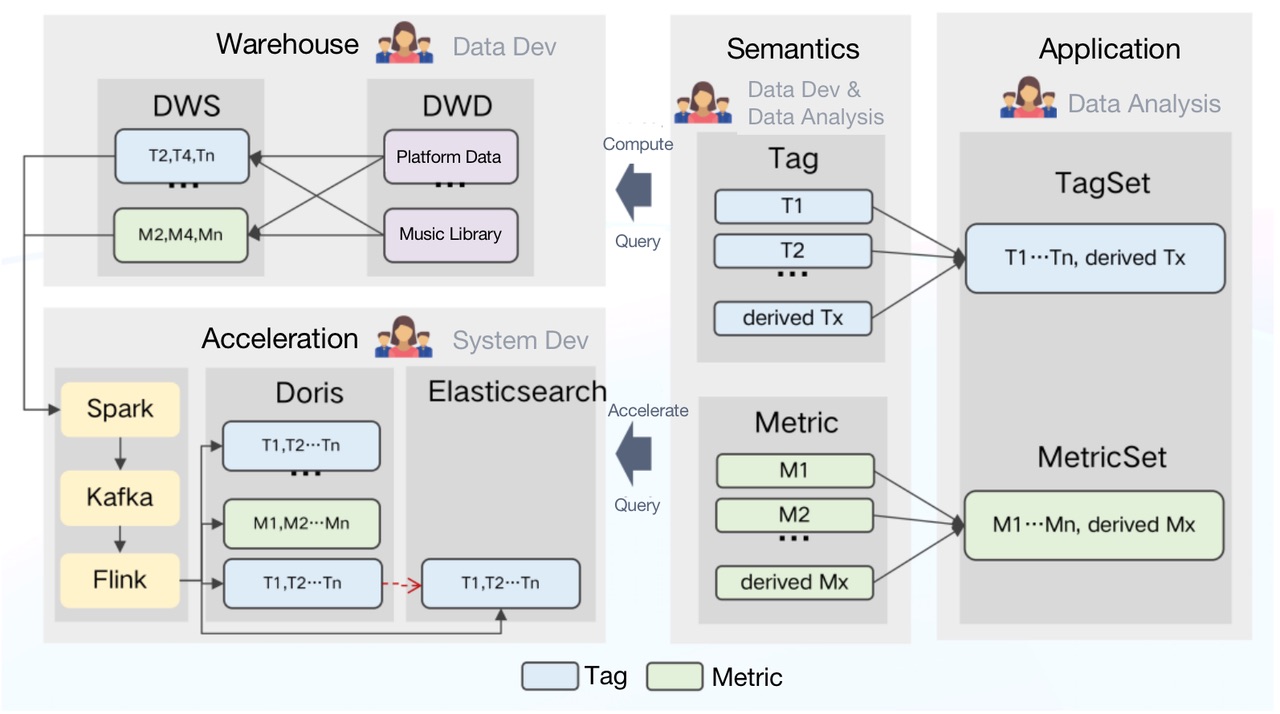
We stored and processed most of our data in Tencent Data Warehouse (TDW), an offline data platform where we put the data into various tag and metric systems and then created flat tables centering each object (songs, artists, etc.).
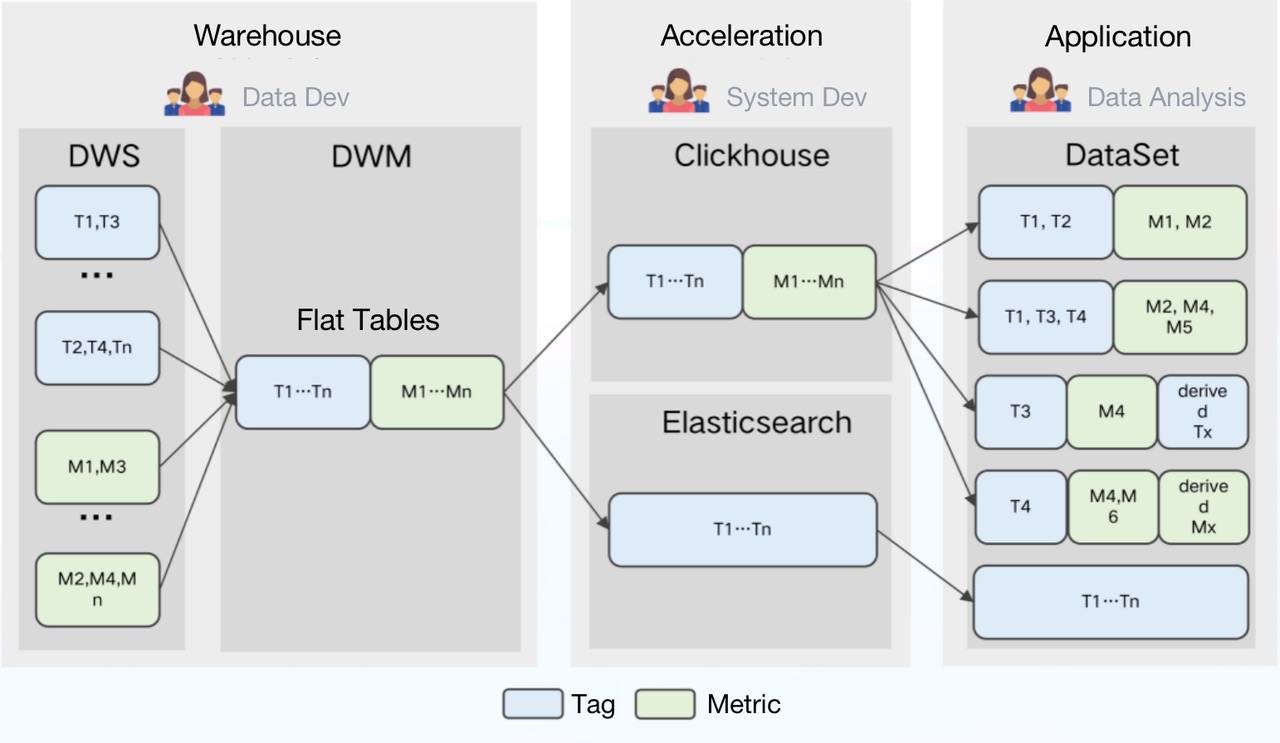
Then we imported the flat tables into ClickHouse for analysis and Elasticsearch for data searching and group targeting.
After that, our data analysts used the data under the tags and metrics they needed to form datasets for different usage scenarios, during which they could create their own tags and metrics.
The data processing pipeline looked like this:
The Problems with ClickHouse
When working with the above pipeline, we encountered a few difficulties:
-
Partial Update: Partial update of columns was not supported. Therefore, any latency from any one of the data sources could delay the creation of flat tables, and thus undermine data timeliness.
-
High storage cost: Data under different tags and metrics was updated at different frequencies. As much as ClickHouse excelled in dealing with flat tables, it was a huge waste of storage resources to just pour all data into a flat table and partition it by day, not to mention the maintenance cost coming with it.
-
High maintainence cost: Architecturally speaking, ClickHouse was characterized by the strong coupling of storage nodes and compute nodes. Its components were heavily interdependent, adding to the risks of cluster instability. Plus, for federated queries across ClickHouse and Elasticsearch, we had to take care of a huge amount of connection issues. That was just tedious.
Transition to Apache Doris
Apache Doris, a real-time analytical database, boasts a few features that are exactly what we needed in solving our problems:
-
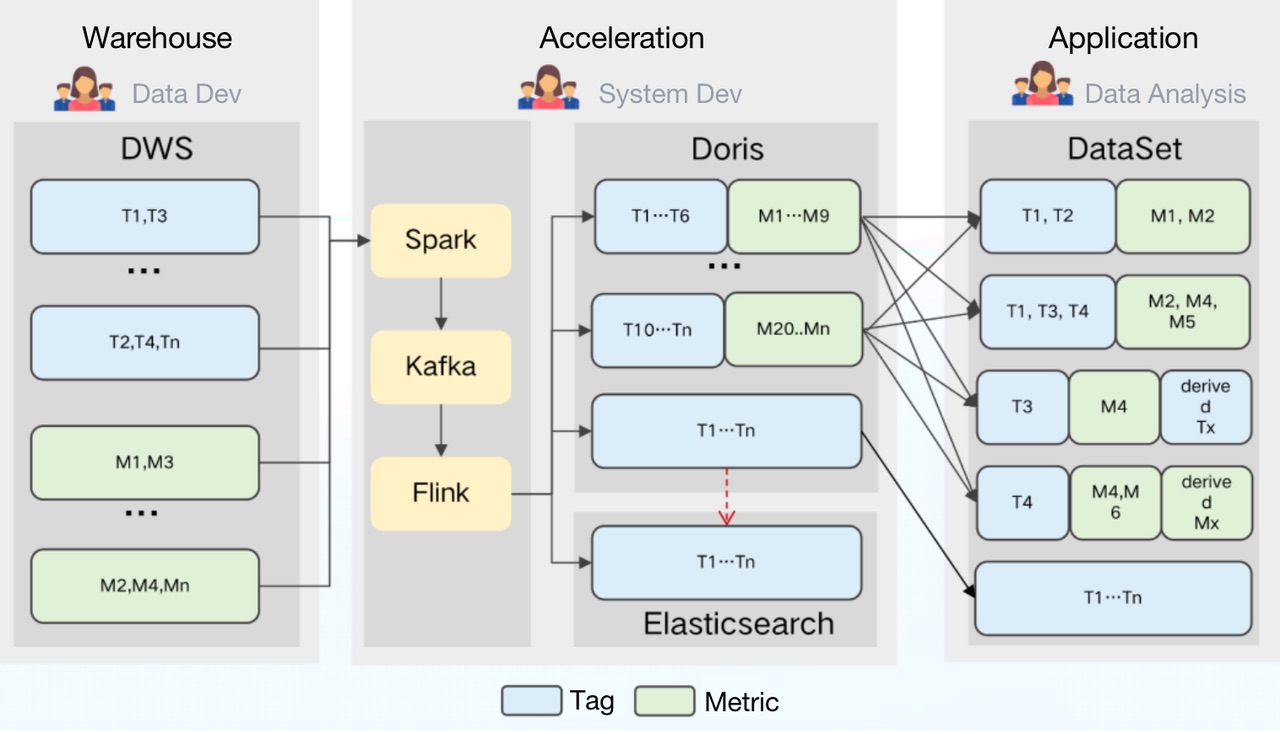
Partial update: Doris supports a wide variety of data models, among which the Aggregate Model supports real-time partial update of columns. Building on this, we can directly ingest raw data into Doris and create flat tables there. The ingestion goes like this: Firstly, we use Spark to load data into Kafka; then, any incremental data will be updated to Doris and Elasticsearch via Flink. Meanwhile, Flink will pre-aggregate the data so as to release burden on Doris and Elasticsearch.
-
Storage cost: Doris supports multi-table join queries and federated queries across Hive, Iceberg, Hudi, MySQL, and Elasticsearch. This allows us to split the large flat tables into smaller ones and partition them by update frequency. The benefits of doing so include a relief of storage burden and an increase of query throughput.
-
Maintenance cost: Doris is of simple architecture and is compatible with MySQL protocol. Deploying Doris only involves two processes (FE and BE) with no dependency on other systems, making it easy to operate and maintain. Also, Doris supports querying external ES data tables. It can easily interface with the metadata in ES and automatically map the table schema from ES so we can conduct queries on Elasticsearch data via Doris without grappling with complex connections.
What's more, Doris supports multiple data ingestion methods, including batch import from remote storage such as HDFS and S3, data reads from MySQL binlog and Kafka, and real-time data synchronization or batch import from MySQL, Oracle, and PostgreSQL. It ensures service availability and data reliability through a consistency protocol and is capable of auto debugging. This is great news for our operators and maintainers.
Statistically speaking, these features have cut our storage cost by 42% and development cost by 40%.
During our usage of Doris, we have received lots of support from the open source Apache Doris community and timely help from the SelectDB team, which is now running a commercial version of Apache Doris.
Further Improvement to Serve Our Needs
Introduce a Semantic Layer
Speaking of the datasets, on the bright side, our data analysts are given the liberty of redefining and combining the tags and metrics at their convenience. But on the dark side, high heterogeneity of the tag and metric systems leads to more difficulty in their usage and management.
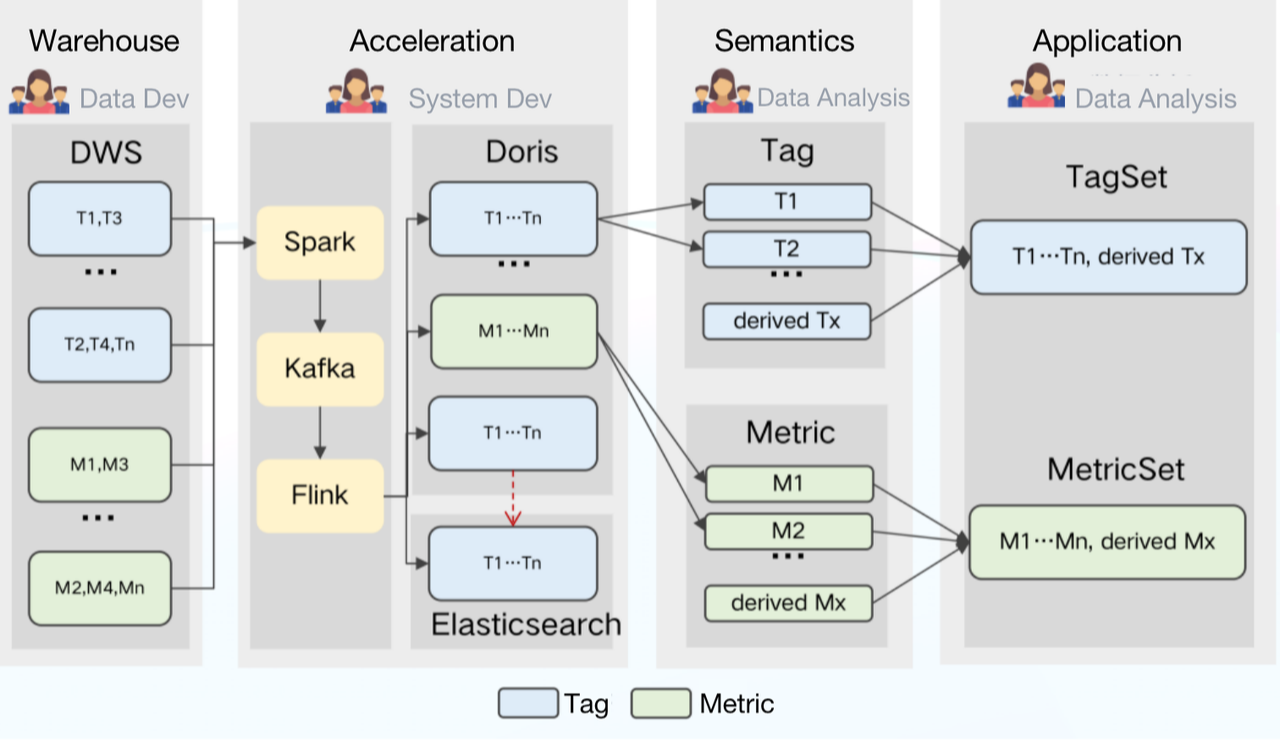
Our solution is to introduce a semantic layer in our data processing pipeline. The semantic layer is where all the technical terms are translated into more comprehensible concepts for our internal data users. In other words, we are turning the tags and metrics into first-class citizens for data definement and management.
Why would this help?
For data analysts, all tags and metrics will be created and shared at the semantic layer so there will be less confusion and higher efficiency.
For data users, they no longer need to create their own datasets or figure out which one is applicable for each scenario but can simply conduct queries on their specified tagset and metricset.
Upgrade the Semantic Layer
Explicitly defining the tags and metrics at the semantic layer was not enough. In order to build a standardized data processing system, our next goal was to ensure consistent definition of tags and metrics throughout the whole data processing pipeline.
For this sake, we made the semantic layer the heart of our data management system:
How does it work?
All computing logics in TDW will be defined at the semantic layer in the form of a single tag or metric.
The semantic layer receives logic queries from the application side, selects an engine accordingly, and generates SQL. Then it sends the SQL command to TDW for execution. Meanwhile, it might also send configuration and data ingestion tasks to Doris and decide which metrics and tags should be accelerated.
In this way, we have made the tags and metrics more manageable. A fly in the ointment is that since each tag and metric is individually defined, we are struggling with automating the generation of a valid SQL statement for the queries. If you have any idea about this, you are more than welcome to talk to us.
Give Full Play to Apache Doris
As you can see, Apache Doris has played a pivotal role in our solution. Optimizing the usage of Doris can largely improve our overall data processing efficiency. So in this part, we are going to share with you what we do with Doris to accelerate data ingestion and queries and reduce costs.
What We Want?
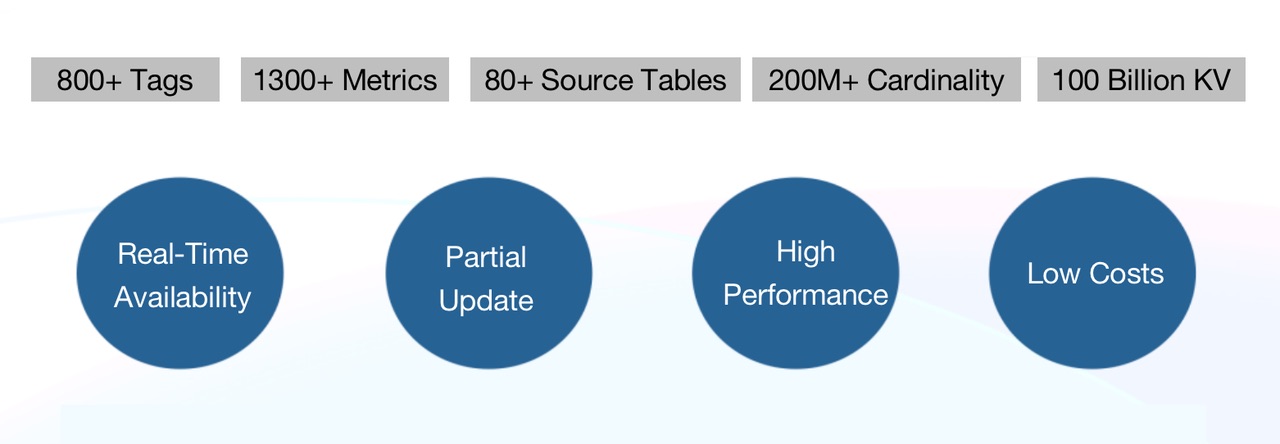
Currently, we have 800+ tags and 1300+ metrics derived from the 80+ source tables in TDW. When importing data from TDW to Doris, we hope to achieve:
-
Real-time availability: In addition to the traditional T+1 offline data ingestion, we require real-time tagging.
-
Partial update: Each source table generates data through its own ETL task at various paces and involves only part of the tags and metrics, so we require the support for partial update of columns.
-
High performance: We need a response time of only a few seconds in group targeting, analysis and reporting scenarios.
-
Low costs: We hope to reduce costs as much as possible.
What We Do?
-
Generate Flat Tables in Flink Instead of TDW
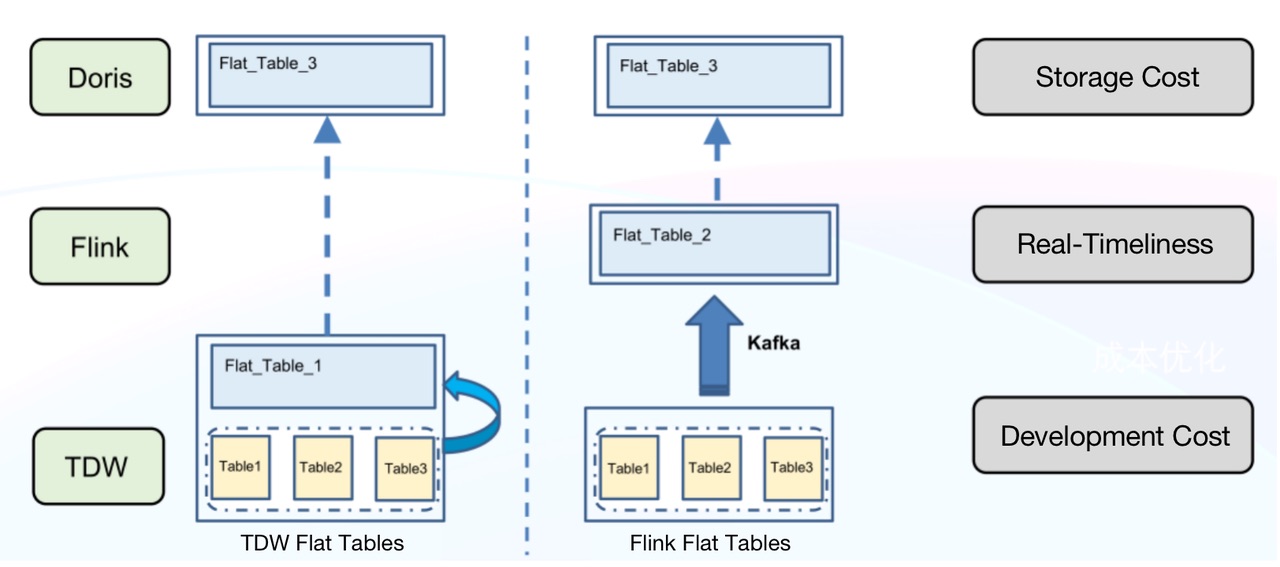
Generating flat tables in TDW has a few downsides:
-
High storage cost: TDW has to maintain an extra flat table apart from the discrete 80+ source tables. That's huge redundancy.
-
Low real-timeliness: Any delay in the source tables will be augmented and retard the whole data link.
-
High development cost: To achieve real-timeliness would require extra development efforts and resources.
On the contrary, generating flat tables in Doris is much easier and less expensive. The process is as follows:
- Use Spark to import new data into Kafka in an offline manner.
- Use Flink to consume Kafka data.
- Create a flat table via the primary key ID.
- Import the flat table into Doris. As is shown below, Flink has aggregated the five lines of data, of which "ID"=1, into one line in Doris, reducing the data writing pressure on Doris.
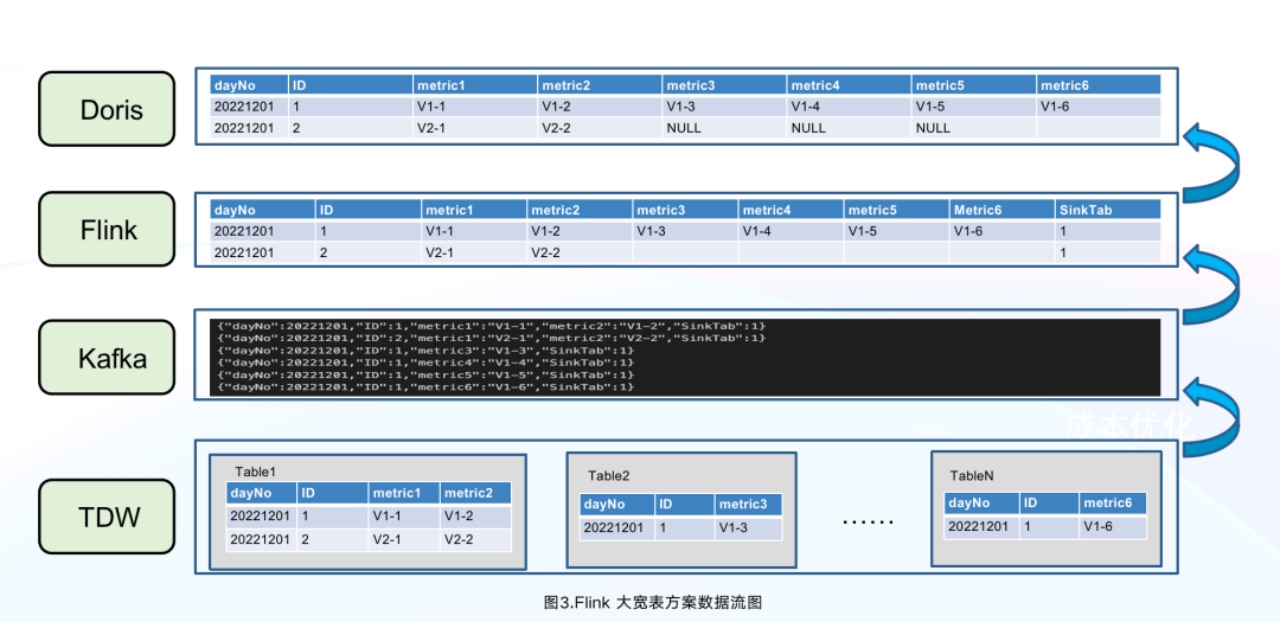
This can largely reduce storage costs since TDW no long has to maintain two copies of data and KafKa only needs to store the new data pending for ingestion. What's more, we can add whatever ETL logic we want into Flink and reuse lots of development logic for offline and real-time data ingestion.
- Name the Columns Smartly
As we mentioned, the Aggregate Model of Doris allows partial update of columns. Here we provide a simple introduction to other data models in Doris for your reference:
Unique Model: This is applicable for scenarios requiring primary key uniqueness. It only keeps the latest data of the same primary key ID. (As far as we know, the Apache Doris community is planning to include partial update of columns in the Unique Model, too.)
Duplicate Model: This model stores all original data exactly as it is without any pre-aggregation or deduplication.
After determining the data model, we had to think about how to name the columns. Using the tags or metrics as column names was not a choice because:
Ⅰ. Our internal data users might need to rename the metrics or tags, but Doris 1.1.3 does not support modification of column names.
Ⅱ. Tags might be taken online and offline frequently. If that involves the adding and dropping of columns, it will be not only time-consuming but also detrimental to query performance. Instead, we do the following:
-
For flexible renaming of tags and metrics, we use MySQL tables to store the metadata (name, globally unique ID, status, etc.). Any change to the names will only happen in the metadata but will not affect the table schema in Doris. For example, if a
song_nameis given an ID of 4, it will be stored with the column name of a4 in Doris. Then if thesong_nameis involved in a query, it will be converted to a4 in SQL. -
For the onlining and offlining of tags, we sort out the tags based on how frequently they are being used. The least used ones will be given an offline mark in their metadata. No new data will be put under the offline tags but the existing data under those tags will still be available.
-
For real-time availability of newly added tags and metrics, we prebuild a few ID columns in Doris tables based on the mapping of name IDs. These reserved ID columns will be allocated to the newly added tags and metrics. Thus, we can avoid table schema change and the consequent overheads. Our experience shows that only 10 minutes after the tags and metrics are added, the data under them can be available.
Noteworthily, the recently released Doris 1.2.0 supports Light Schema Change, which means that to add or remove columns, you only need to modify the metadata in FE. Also, you can rename the columns in data tables as long as you have enabled Light Schema Change for the tables. This is a big trouble saver for us.
- Optimize Date Writing
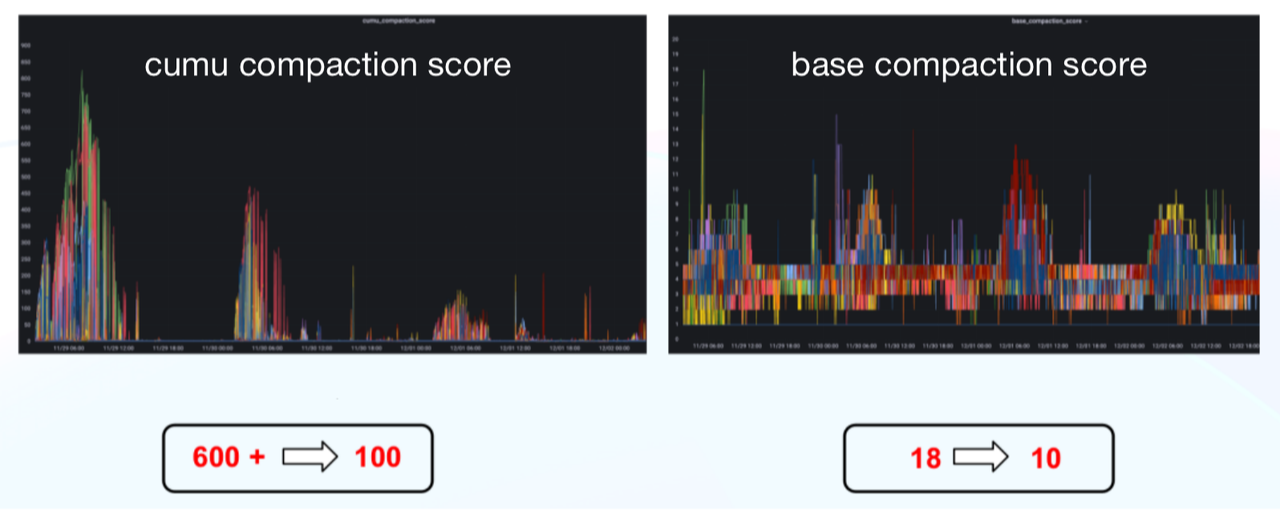
Here are a few practices that have reduced our daily offline data ingestion time by 75% and our CUMU compaction score from 600+ to 100.
-
Flink pre-aggregation: as is mentioned above.
-
Auto-sizing of writing batch: To reduce Flink resource usage, we enable the data in one Kafka Topic to be written into various Doris tables and realize the automatic alteration of batch size based on the data amount.
-
Optimization of Doris data writing: fine-tune the the sizes of tablets and buckets as well as the compaction parameters for each scenario:
max_XXXX_compaction_thread max_cumulative_compaction_num_singleton_deltas -
Optimization of the BE commit logic: conduct regular caching of BE lists, commit them to the BE nodes batch by batch, and use finer load balancing granularity.
-
Use Dori-on-ES in Queries
About 60% of our data queries involve group targeting. Group targeting is to find our target data by using a set of tags as filters. It poses a few requirements for our data processing architecture:
-
Group targeting related to APP users can involve very complicated logic. That means the system must support hundreds of tags as filters simultaneously.
-
Most group targeting scenarios only require the latest tag data. However, metric queries need to support historical data.
-
Data users might need to perform further aggregated analysis of metric data after group targeting.
-
Data users might also need to perform detailed queries on tags and metrics after group targeting.
After consideration, we decided to adopt Doris-on-ES. Doris is where we store the metric data for each scenario as a partition table, while Elasticsearch stores all tag data. The Doris-on-ES solution combines the distributed query planning capability of Doris and the full-text search capability of Elasticsearch. The query pattern is as follows:
SELECT tag, agg(metric)
   FROM Doris
   WHERE id in (select id from Es where tagFilter)
   GROUP BY tag
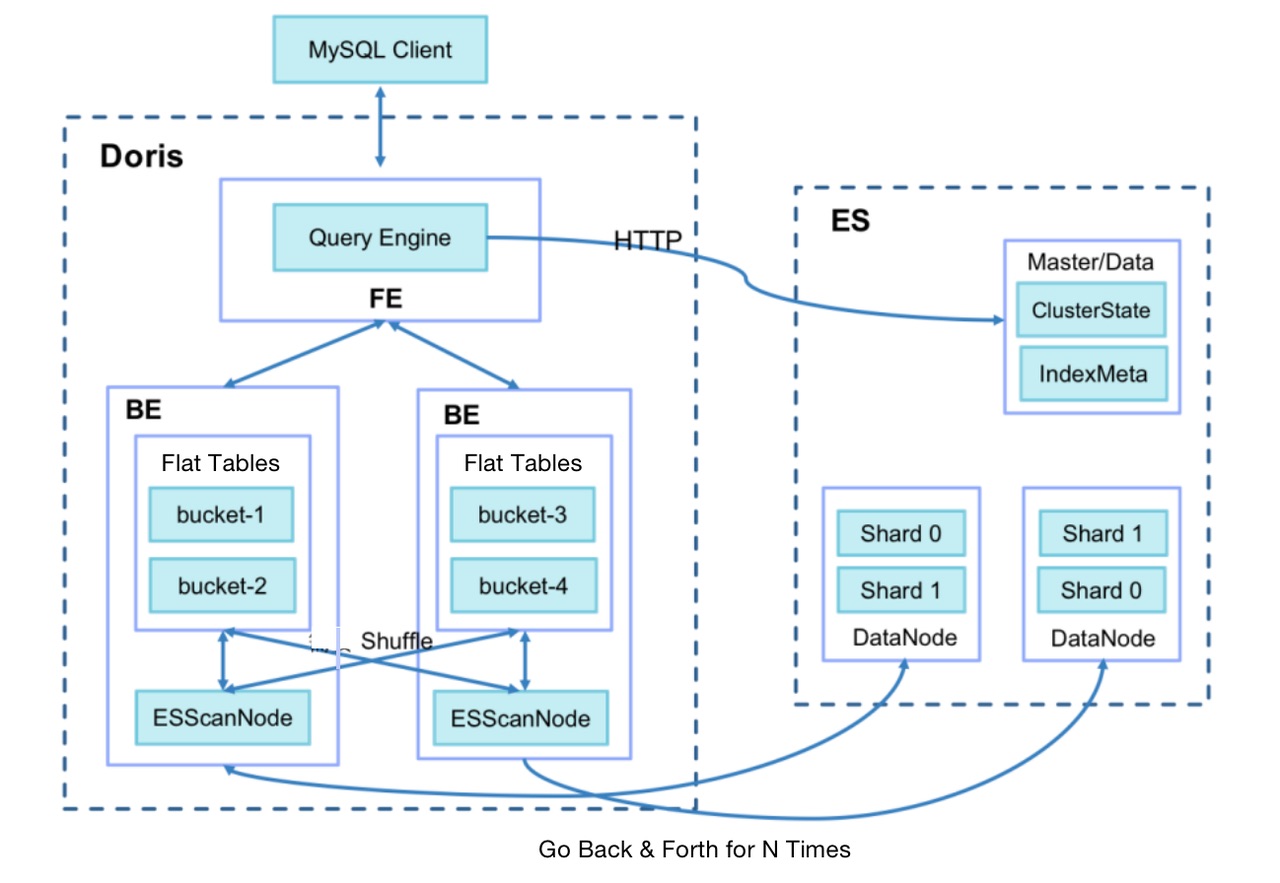
As is shown, the ID data located in Elasticsearch will be used in the sub-query in Doris for metric analysis. In practice, we find that the query response time is related to the size of the target group. If the target group contains over one million objects, the query will take up to 60 seconds. If it is even larger, a timeout error might occur. After investigation, we identified our two biggest time wasters:
I. When Doris BE pulls data from Elasticsearch (1024 lines at a time by default), for a target group of over one million objects, the network I/O overhead can be huge.
II. After the data pulling, Doris BE needs to conduct Join operations with local metric tables via SHUFFLE/BROADCAST, which can cost a lot.
Thus, we make the following optimizations:
-
Add a query session variable
es_optimizethat specifies whether to enable optimization. -
In data writing into ES, add a BK column to store the bucket number after the primary key ID is hashed. The algorithm is the same as the bucketing algorithm in Doris (CRC32).
-
Use Doris BE to generate a Bucket Join execution plan, dispatch the bucket number to BE ScanNode and push it down to ES.
-
Use ES to compress the queried data; turn multiple data fetch into one and reduce network I/O overhead.
-
Make sure that Doris BE only pulls the data of buckets related to the local metric tables and conducts local Join operations directly to avoid data shuffling between Doris BEs.
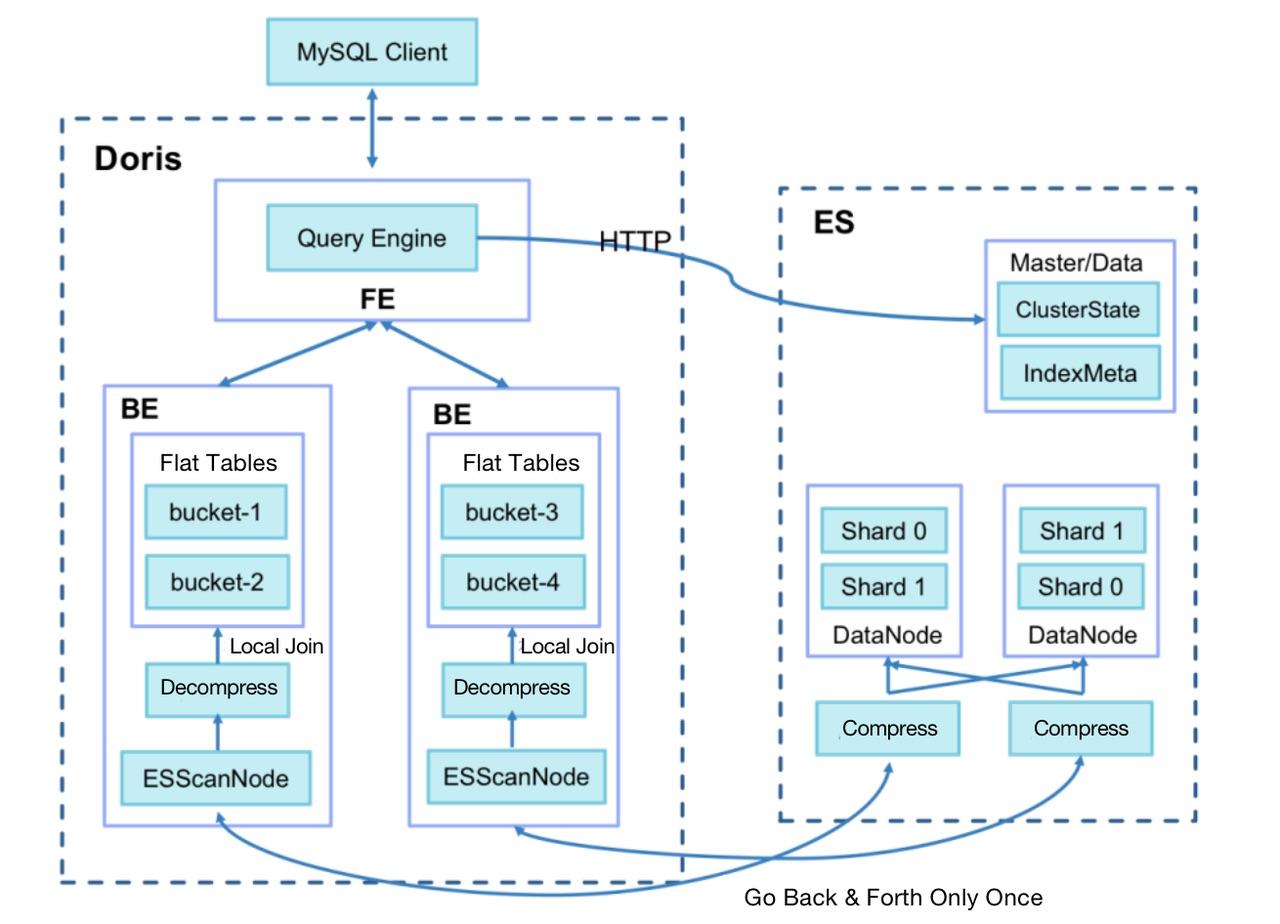
As a result, we reduce the query response time for large group targeting from 60 seconds to a surprising 3.7 seconds. Community information shows that Doris is going to support inverted indexing since version 2.0.0, which is soon to be released. With this new version, we will be able to conduct full-text search on text types, equivalence or range filtering of texts, numbers, and datetime, and conveniently combine AND, OR, NOT logic in filtering since the inverted indexing supports array types. This new feature of Doris is expected to deliver 3~5 times better performance than Elasticsearch on the same task.
- Refine the Management of Data
Doris' capability of cold and hot data separation provides the foundation of our cost reduction strategies in data processing.
-
Based on the TTL mechanism of Doris, we only store data of the current year in Doris and put the historical data before that in TDW for lower storage cost.
-
We vary the numbers of copies for different data partitions. For example, we set three copies for data of the recent three months, which is used frequently, one copy for data older than six months, and two copies for data in between.
Doris supports turning hot data into cold data so we only store data of the past seven days in SSD and transfer data older than that to HDD for less expensive storage.
Conclusion
Thank you for scrolling all the way down here and finishing this long read. We've shared our cheers and tears, lessons learned, and a few practices that might be of some value to you during our transition from ClickHouse to Doris. We really appreciate the help from the Apache Doris community and the SelectDB team, but we might still be chasing them around for a while since we attempt to realize auto-identification of cold and hot data, pre-computation of frequently used tags/metrics, simplification of code logic using Materialized Views, and so on and so forth.
[story continues]
tags