
Yet another “control plane”! Why?
Anyone who has built or managed platforms at scale must be familiar with control planes, but maybe not in the context of AI. Typical control planes that you might know about:
- Kubernetes control plane reconciles desired state and enforces policies.
- The service mesh control plane distributes traffic and telemetry configuration.
- API gateway control plane manages auth, quotas, routing, rate limits.
LLM/Agentic/AI applications need the same idea because the ‘request’ isn't only an HTTP call. It’s prompt, often with retrieved context, a chain of tool calls, and non-deterministic outputs – plus security risks like prompt injection and sensitive data exfiltration.
So, treat prompts, model calls, retrieval, and tools as first-class production components that are instrumented and governed like microservices and data.
What is the AI Control Plane?
The AI control plane is a shared platform layer that sits on the execution path of your LLM workloads to provide:
- Observability: traces, metrics, logs for model and tool calls
- Quality controls: evals, canaries, regression tests, drift detection
- Policy enforcement: data/PII rules, tool permissions, safety filters, schema checks
- Cost management: budgets, attribution, rate limits, token quotas, showback/chargeback
- Operational safety: circuit breakers for agent loops, caching, fallbacks
What is it not: your app logic. If your “control plane” contains app decision logic, it becomes a bottleneck. Keep it thin, consistent and ubiquitous.
Start with a request “envelope”/metadata (the minimum contract)
Similar to a standard header set for your microservices, define what every LLM interaction must carry.
Example header fields:
- trace_id / span_id (distributed tracing correlation)
- tenant_id and user_id (ideally hashed)
- prompt_id + prompt_version
- policy_profile (which rule set applies)
- model_route (provider + model + fallback strategy)
- data_classification
- (public/internal/confidential/restricted)
- budget_key (cost attribution label, e.g., team=payments,
- feature=claims_assistant)
- environment (dev/stage/prod) + release_version
Example header:
{
"trace_id": "4bf92f3577b34da6a3ce929d0e0e4736",
"tenant_id": "acme-co",
"user_id_hash": "u_8f3b…",
"conversation_id": "conv_2026_01_18_001",
"prompt_id": "support_reply",
"prompt_version": "v17",
"policy_profile": "support-prod",
"model_route": "primary:gpt-4.x
fallback:gpt-4o-mini",
"data_classification": "confidential",
"budget_key": "team:support feature:assistant",
"env":"prod",
"release_version": "2026.01.18"
}
This “envelope”/”header” becomes the unique key across traces, evals, incidents, and costs.
Observability: instrument prompts like microservices
Distributed tracing: every model call is a span, and every tool is a child span
LLM app is a distributed system:
- App > orchestrator/agent > retrieval > model > tool(s) > model > response
So instrument it with the same discipline:
- one root span for the user request
- nested spans for:
- retrieval (vector DB/search/MCP)
- model inference
- tool invocations (CRM lookup, ticket creation, payments, etc.)
- Safety classifiers and validators
Use standard semantics where possible, and for cross-service correlation, propagate trace context headers.
1) Practical span attributes you’ll actually use
- gen_ai.operation.name (e.g., chat, embeddings)
- gen_ai.provider.name
- gen_ai.request.model
- gen_ai.conversation.id
- gen_ai.usage.input_tokens,
- gen_ai.usage.output_tokens
- gen_ai.request.temperature, gen_ai.request.max_tokens (when applicable)
- tool.name, tool.result_status, tool.latency_ms
- prompt.id, prompt.version
- policy.decision (allow/deny/redact)
- budget.key, budget.remaining
Note: content capture (full propmpts/responses) is a high risk.
Code Example: wrapping an LLM call with OpenTelemetry (python pseudocode)
import time
from opentelemetry import trace, metrics

tracer = trace.get_tracer("ai.app")
meter = metrics.get_meter("ai.app")

token_usage = meter.create_histogram("gen_ai.client.token.usage", unit="{token}")
op_duration = meter.create_histogram("gen_ai.client.operation.duration", unit="s")
def call_llm(envelope, model, messages, temperature=0.2, max_tokens=600):
  start = time.perf_counter()

  span_name = f"chat {model}"
  with tracer.start_as_current_span(span_name) as span:
      span.set_attribute("gen_ai.operation.name", "chat")
      span.set_attribute("gen_ai.provider.name",
      envelope["model_route"].split()[0].split(":")[1])
      span.set_attribute("gen_ai.request.model", model)
      span.set_attribute("gen_ai.conversation.id", envelope["conversation_id"])
      span.set_attribute("prompt.id", envelope["prompt_id"])
      span.set_attribute("prompt.version", envelope["prompt_version"])
      span.set_attribute("budget.key", envelope["budget_key"])

      # DO NOT store raw messages/content by default.
      resp = llm_client.chat (messages=messages, temperature=temperature, max_tokens=max_tokens)
      dur = time.perf_counter() - start
      span.set_attribute ("gen_ai.usage.input_tokens", resp.usage.input_tokens)
      span.set_attribute ("gen_ai.usage.output_tokens", resp.usage.output_tokens)

      # Metrics aligned with GenAI conventions
      attrs = {
        "gen_ai.operation.name": "chat",
        "gen_ai.provider.name":"openai",
        "gen_ai.request.model":model
      }
      op_duration.record(dur, attributes=attrs)
      token_usage.record(resp.usage.input_tokens, attributes={**attrs, "gen_ai.token.type": "input"})
      token_usage.record(resp.usage.output_tokens, attributes={**attrs, "gen_ai.token.type": "output"})
      return resp.output_text
2) Logging: avoid the raw text but keep the ‘why'
Traditional logs are usually safe because requests are mostly structured and expected.
LLM logs are a bit different. Prompts can contain:
- Customer messages
- Internal docs
- Credentials pasted by users
- PII data
So the control plane should support tiered logging:
Tier A (always on, safe metadata)
- Prompt hash, prompt version
- Model & parameters
- Token counts, latency
- Tool list & status
- Policy decisions
- Evaluation score
- Error codes
Tier B (redacted/samples, controlled by incident workflow)
- Redacted prompt & response snippets
- Tool arguments with sensitive fields masked
- Captured only for selected tenant/users, time windows, or debugging sessions
Tier C (never in central logs)
- Raw unredacted content unless you have explicit legal/infosec approval and strong access controls
PII redaction: build a “PII firewall” (and don’t trust it blindly)
PII redaction should happen in two places:
- Before the model call (don’t send what you shouldn’t)
- Before persistence (don’t store what you shouldn’t)
Some tools (e.g., Microsoft Presidio) can detect/anonymize PII, but there is no guarantee it will catch everything; hence, you still need layered protections.
A good PII redaction pipeline would look like:
- classify content (public/internal/confidential)
- detect PII (pattern + NLP + allowlist/denylist)
- apply transformation:
- redact ([redacted_email])
- mask (j***@example.com)
- tokenize/pseudonymize (stable per tenant if needed)
- emit a redaction report into a trace such as:
- which entities were found
- which policy was applied
- confidence score
- store only the redacted form in logs
Conceptual example:
# Pseudocode only
entities = pii_detector.detect (text)
if policy.requires_redaction (entities):
  text = pii_detector.redact(text)
  span.set_attribute("policy.pii.redacted", True)
  span.set_attribute("policy.pii.types", [e.type for e in entities])
Policy enforcement: guardrails must be coded and not rely on “a better prompt.”
Prompts can help, but prompts are not enforcement. LLMs are inherently probabilistic, and prompts are suggestions to a probabilistic system.
A control plane enforces policy at Policy Decision Points (PDPs) such as:
- Ingress: before the prompt enters the orchestrator
- Pre-model: before calling the LLM provider
- Tool execution: before invoking a sensitive integration
- Egress: before returning output to the user
- Persistence: before saving transcripts, embeddings, or traces
Enterprise grade set of policies that are worth enforcing
Data policies
- PII/PCI/PHI detection and transformation
- “No secrets to model” (API keys, credentials)
- retrieval access control (RBAC/ABAC on documents)
Tool policies
- tool allowlists per role/tenant
- argument validation (schema & allowlists)
- read vs. write separation (e.g., ticket “create” requires higher privilege than “search”)
Output policies
- JSON schema validation
- citation/grounding requirement for high-stakes answers
- safety filters and disallowed content checks
Rate limiting: tokens are the new performance currency
In microservices, we rate-limit requests. LLM apps must rate-limit following:
- requests
- tokens
- tool calls
- agent steps
- wall-clock time per conversation
If you only rate-limit requests, an attacker (or a buggy agent) can still burn budget by generating huge outputs or looping tool calls.
You should enforce:
- max tokens per minute per tenant
- max concurrent in-flight LLM calls per tenant
- max tool calls per request
- max agent steps
- max total tokens per conversation
- circuit breaker on repeated failure modes (timeouts, tool errors, policy denials)
FinOps for LLM apps: LLM calls are expensive, cost management isn’t optional
FinOps is an operating model that creates financial accountability through collaboration between engineering, finance, and business teams. FinOps is extensively used in cloud context. However, that definition applies perfectly to LLM applications because costs scale with:
- traffic volume
- prompt size (context window)
- tool loops
- model choice
- retries and fallbacks
The control plane makes cost a first-class signal
If telemetry captures budget_key, prompt_version, model, and token usage, you can do what mature cloud FinOps teams do:
- showback: “who spent what?”
- unit cost: cost per ticket resolved, cost per claim processed, cost per onboarding
- budget guardrails: block or degrade when budgets hit thresholds
- cost anomaly alerts: “token usage per session is up 70% vs. baseline”
Low-effort cost wins that don’t compromise on quality
- Prompt trimming: remove redundant system text; compress long instructions into stable IDs resolved server-side.
- Context development: retrieval top-k tuned per query type; don’t fetch 20 docs “just in case.”
- Model routing: cheap model for classification/extraction; expensive model for synthesis.
- Caching:
- semantic cache for repeated Q&A patterns
- tool result cache (e.g., “current plan benefits”) with TTL
- Stop agent runaway: hard caps on steps/tool calls/tokens.
Evals: the must-have quality gate for prompt & tool changes
Microservices use unit tests, contract tests, canaries, and SLOs.
LLM apps need the same, along with content evaluation.
Evaluations (evals) are explicit tests of the LLM output against your expectations; these are essential for reliability, especially when changing models or versions of prompts.
A practical eval stack that works
Level 1: Prompt unit tests (fast, deterministic-ish)
- input -> expected format constraints (JSON schema, required keys)
- basic refusal behavior on unacceptable inputs
- tool selection rules (“should call get_policy_docs when user asks about policy”)
Level 2: Golden-set regression suite (CI gate)
- representative prompts and retrieved context
- rubric-based scoring (helpfulness, correctness, groundedness, policy compliance)
- pass/fail thresholds by slice (region, tenant, language, scenario)
Level 3: Shadow evaluation in production
- sample live traffic (with privacy controls)
- evaluate outputs asynchronously
- detect drift and regressions without blocking requests
Level 4: Human-in-the-loop for high-stakes domains
- annotation workflows for disputes
- periodic adjustment of automated judges
Pro tip: treat eval datasets like code. Version them. Review changes. Track coverage by scenario.
Drift detection: what changes even when you don’t deploy
LLM systems drift for reasons that don’t show up in Git history:
- provider silently changes model behavior
- your retrieval set changes
- tool APIs change shape
- user behavior changes (new season, new product, new fraud patterns)
Use standards such as NIST’s AI RMF (and its generative AI profile) as a reference point for thinking about operational risk over time and not just “does it work today?”
Drift signals worth monitoring that’ll provide key insights
- spike in tokens per response (often indicates prompt bloat or retrieval noise)
- increase in tool call count per request (agent loops or new ambiguity) rising refusal rate or policy blocks
- drop in groundedness/citation rate
- increase in format violations (JSON parsing errors)
- semantic shift in queries (topic embeddings distribution drift)
- new error clusters (timeouts, rate limits, tool failures)
A good control plane turns drift into dashboards and alerts, not vague “users say it feels worse.”
Reference architecture: how the AI Control Plane fits
Here’s a vendor-neutral conceptual architecture that can be adopted:
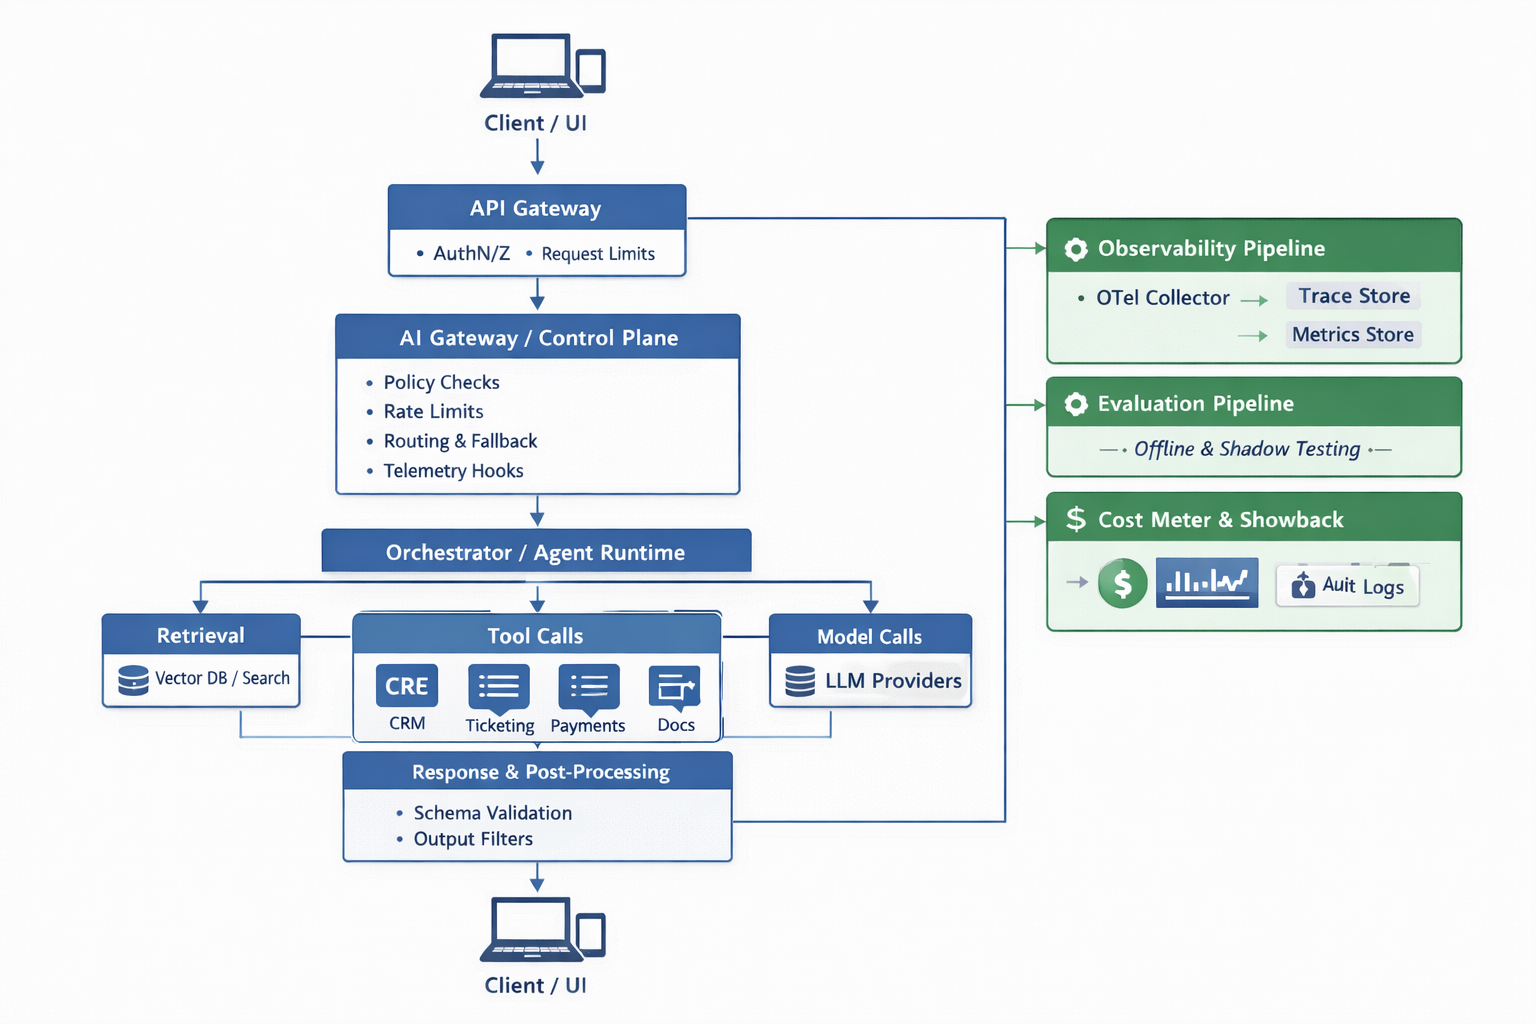
If you’re already managing microservices with OpenTelemetry, this is a natural extension, just with additional guardrails. LangFuse is a good open-source framework to get started on the AI control plane.
Conclusion: you can’t scale what you can’t explain
Most “LLM incidents” aren’t model bugs. They are LLM app bugs that are missing trace context, unknown prompt versions, unmetered tool loops, or a lack of policy enforcement boundaries. An AI control plane doesn’t improve the intelligence of a model. What it does is make the overall system manageable and reliable, which is what allows teams to run and scale LLM applications safely.
[story continues]
tags