
This article describes a hypothetical but realistic scenario, synthesized from patterns commonly observed in large enterprise and retail BI environments. While inspired by real-world experiences, the situation, figures, and timelines have been intentionally anonymized and generalized.
Our team owned the data.
We owned the ingestion pipelines.
We owned the transformations.
We owned the semantic model that powered enterprise reporting.
The dashboard, however, was built by another team - on top of the model we maintained.
That’s how self-serve analytics is supposed to work.
And most of the time, it does.
Most analytics failures are not caused by bad data, but by the absence of shared meaning - MIT Sloan Management Review.
At the time, we didn’t realize we were missing exactly that.
The Meeting We Weren’t In
The executive review happened without us.
The team conducts their weekly retail performance assessment conference which they hold every week.
Same deck. Same cadence.
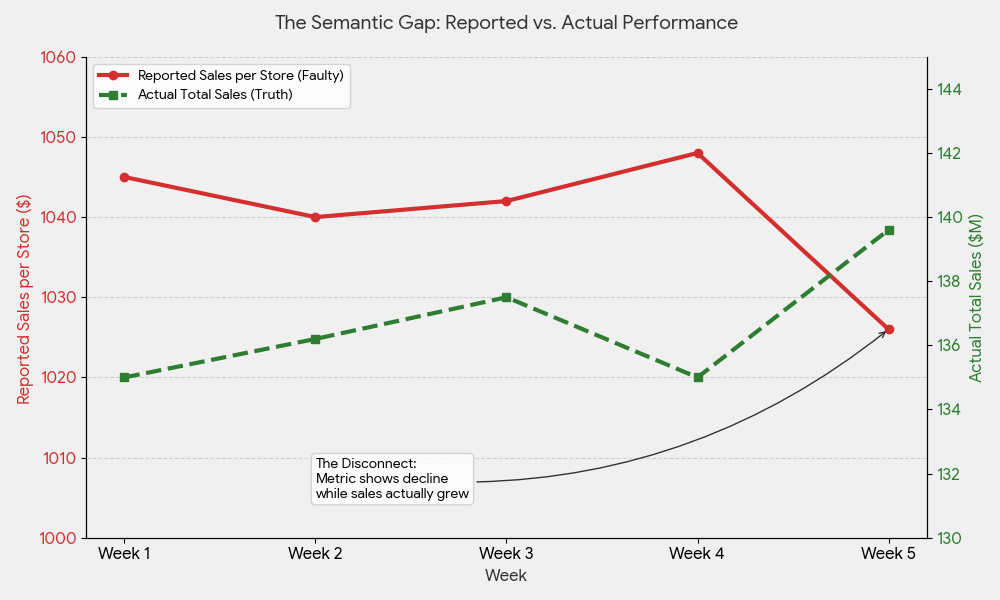
One slide showed a 2.1% week-over-week decline in sales per store.
Not catastrophic.
But enough to justify action.
Someone in the room said:
Looks like demand is softening. Let’s pull back inventory on the long-tail SKUs.
Heads nodded.
Forecasts were adjusted.
The decision moved forward.
We didn’t know any of this yet.
When It Came Back to the Our Team
Our inbox received a message which arrived two days after the initial contact.
Hey - can you double-check the sales numbers? Leadership is seeing a decline.
That’s usually the first signal.
Not that the data is wrong but that the outcome doesn’t feel right.
When decisions don’t align with operational reality, the issue is often semantic, not technical - Harvard Business Review.
The Shocking Moment
We went straight to the source.
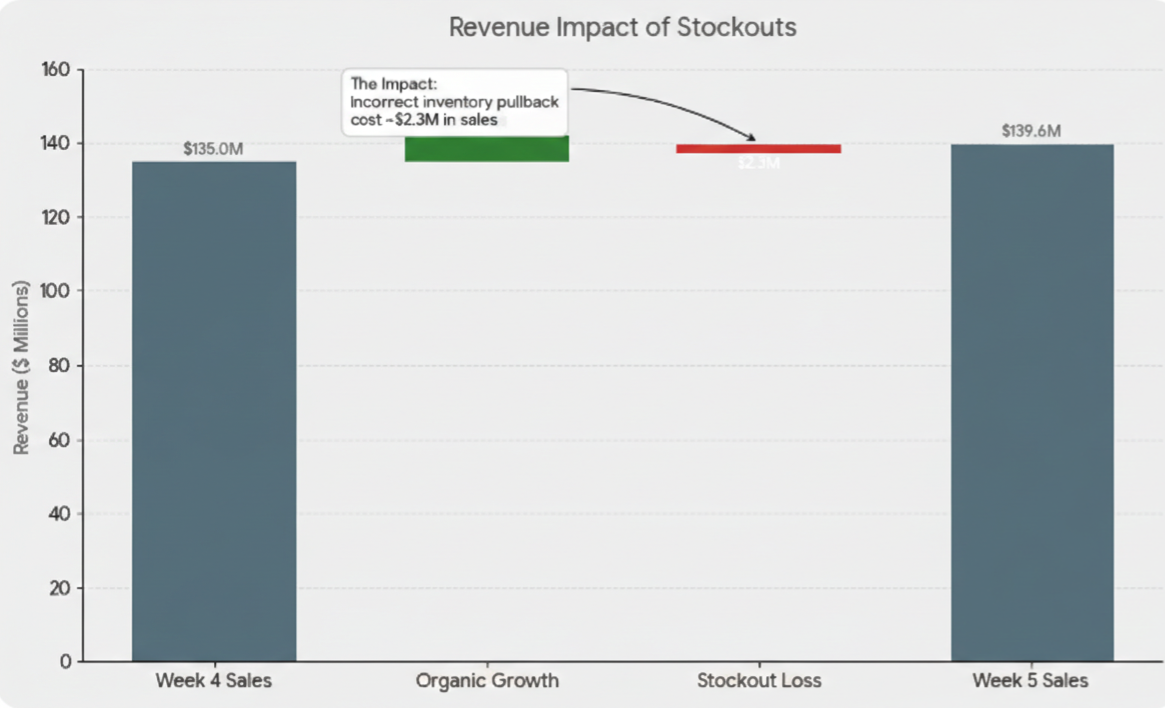
Across 300 stores, total sales were up $4.6M week over week.
- Gross revenue: +3.4%
- Units sold: +2.8%
- Average ticket: flat
There was no demand problem. No traffic problem. No pricing issue.
The dashboard wasn’t lying. It just wasn’t telling the whole story.
Where the Disconnect Happened
The dashboard team had defined a metric:
Sales per store
It was calculated as Total sales / Count of stores with at least one transaction that week
That week:
- 47 stores recorded zero transactions
- Weather-related closures
- Staffing gaps
- Temporary system outages
Those stores were excluded from the denominator.
Silently.
No warning. No annotation. No visible context.
The math was correct.
The meaning had shifted.
When infrastructure is used to encode business meaning, systems become brittle - DAMA International.
Why This Slipped Through
From the dashboard team’s perspective:
- The logic was reasonable
- The metric validated
- The numbers looked clean
From our perspective:
- A different business question was being answered
- Context was missing
Semantic intent was unclear
No one was careless. No pipeline failed. No rule was violated.
Ownership of data was clear.
Ownership of metric meaning was not.
If different users can derive different truths from the same data, governance has already failed - Gartner.
The Cost of That Gap
The decision had already propagated.
Inventory planning changes included:
- Replenishment reduced on ~1,200 SKUs
- Forecast overrides across five categories
- Safety stock tightened by 8–12%
Three weeks later:
-
68 stores stocked out on fast-moving items
-
Estimated lost sales: ~$2.3M
-
Customer complaints increased
-
Store managers escalated
That’s when the question changed from:
Is the data wrong?
To:
Why did two teams interpret the same metric differently?
Nothing Was Broken
The pipelines ran.
The refresh succeeded.
The dashboard passed QA.
Self-serve analytics worked exactly as designed.
And that’s the problem.
Self-serve analytics doesn’t fail loudly. It fails expensively.
Modern analytics failures are rarely technical; they are semantic and organizational - TDWI.
1. Every Decision-Grade Metric Got a Mandatory Definition Block
We introduced a standard definition format that had to appear in both documentation and dashboards:
- Business intent
- Inclusion rules
- Exclusion rules
- Known edge cases
If a metric could influence inventory, staffing, or pricing, this block was non-negotiable.
Governance mechanisms should be explicit, not inferred from structure - ISO (information governance guidance).
2. Dashboards Required an Explicit Interpretation Note
Any dashboard built on shared models had to include:
- A short “How to read this” section
- Key assumptions
- Scenarios where interpretation could break
This wasn’t about education.
It was about preventing silent misreads.
3. We Standardized a Lightweight Metric Glossary
Not a wiki no one reads.
A simple enforced structure:
- One metric name
- One definition
- One owner
- One allowed calculation
If teams needed a variation, it had to be named differently.
No shared labels. No shared ambiguity.
Duplication of definitions is often mistaken for flexibility - Forrester.
4. Dashboard Design Followed a Shared Template
We aligned on a basic design standard:
- Definitions visible, not hidden
- Filters explained, not implied
- Aggregations explicit, not assumed
This wasn’t about consistency for its own sake.
It was about making intent visible.
The Result Wasn’t Less Self-Serve — It Was Better Self-Serve
Teams didn’t stop building dashboards.
They stopped guessing.
Fewer follow-ups.
Fewer rechecks.
Fewer post-meeting clarifications.
Not because people were restricted.
Because meaning was encoded, not remembered.
The Real Lesson
Owning the data is not enough.
Owning the semantic contract is what prevents expensive mistakes.
As an aspiring leader in BI, my role wasn’t to approve every dashboard.
It was to make sure that when dashboards were built, they couldn’t quietly change the question being answered.
Systems always behave according to the assumptions built into them - Donella Meadows, systems thinker.
Final Thought
The most dangerous BI systems aren’t the broken ones.
They’re the ones that:
- Load fast
- Look clean
- Empower everyone
- And leave interpretation implicit
The report was perfect.
The decision cost us millions.
What prevented it from happening again wasn’t control.
It was clarity.
[story continues]
tags