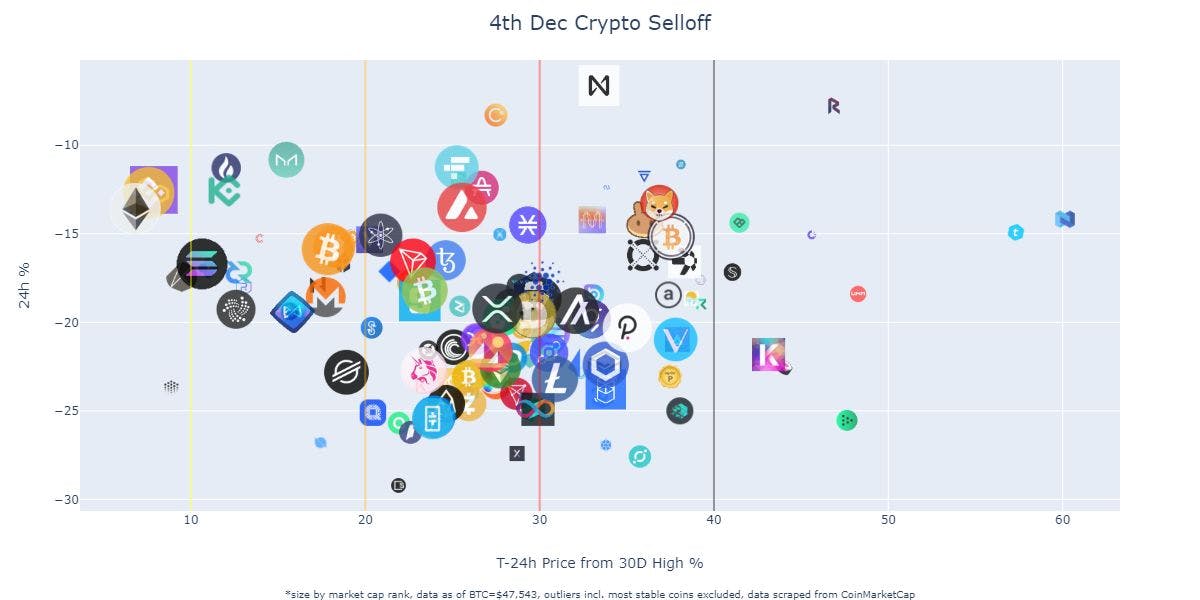
An Altcoin Perspective

Feels amazing to be back after a 1-year hiatus! I recently started my full-time job and have not been so active in data science but I would like to start going at it again. It’s virtually impossible to ignore what’s going on in crypto markets right now and it’s super exciting to explore what we can do here with all the data and opportunities. It’s been a while so I’m starting with something light this round.

December 4th Crypto Selloff

Crypto markets were hit with a wave of de-risking recently on several possible factors:

A Quick Data Collection Process

I scraped price data, token images and basic data from CoinMarketCap for free using python’s requests and beautifulsoup instead of using CMC’s API. I started scraping them when BTC prices were $47,543, which was shortly after the bottoms when things stabilized for a bit. Was busy checking my positions when it all happened… haha.

Visualizing the data

I used plotly which looked great and was easy to use. I also used PIL to store the coin image objects for the plots and sized them up based on their market cap rank. I plotted the daily 24h % price change against the T-24h Price from 30D High expressed as a percentage, as I wanted to see how far we were from recent tops before this selloff. I also excluded most stable coins to see the other coins better.

Analyzing the data

There are several observations that we can make with a little bit of extra digging:
Well, I’m sure you can derive more from this and it is definitely just a starting point for further analysis. 

Conclusion

It seems like there is a very general downward pressure that suggests that the further coins have come off the last rally, the further they have continued to drop in the recent selloff. I am curious to find out what else you see here and what your next steps would be. Please reach out to me on linkedin!